Slide 6 of 13 from Pediatrics PowerPoint Template
Growth & Health Monitoring Dashboard PowerPoint
Growth & Health Monitoring Dashboard Overview
- Chart
- Line Chart
- Statistics Slide
- 16:9
- 100% Editable
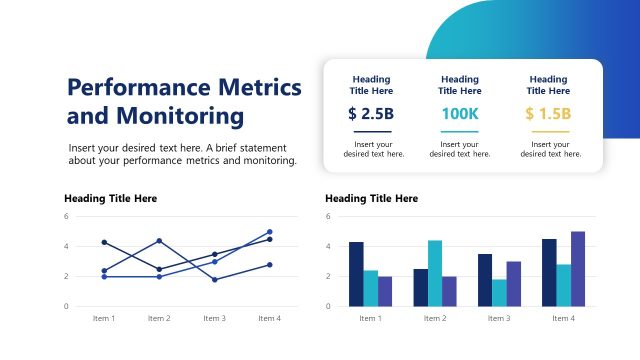
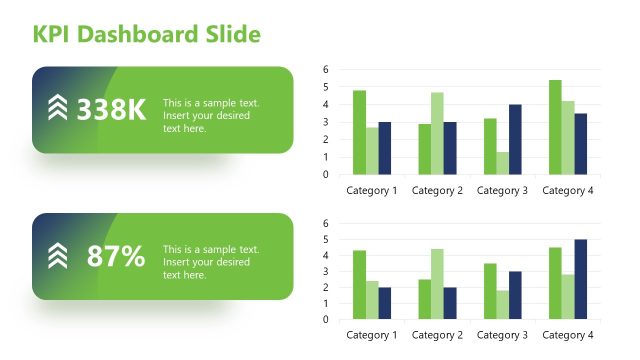
The Growth & Health Monitoring Dashboard slide from the Pediatrics PowerPoint Template offers a clear layout for displaying pediatric health metrics using editable slides. Featuring a line chart and key statistics on vaccination rates and BMI, this slide supports healthcare professionals in creating effective business presentations and corporate presentations focused on child health monitoring.
What’s on This Slide
The slide features a line chart positioned centrally, displaying two growth metrics over a 12-month period. The chart has a light background with a subtle gradient, enhancing visibility. Above the chart, there is a title aligned to the left, followed by a subtitle placeholder. To the right, two sections present key metrics: vaccination completion and healthy BMI range, each with a percentage figure and a small upward arrow indicating growth. Text placeholders for descriptions are included below each metric, maintaining a clear visual hierarchy.
How to Use It
This layout serves as a dashboard for presenting growth and health metrics in a healthcare context. It is suitable for tracking pediatric health indicators and can fit into a presentation sequence after discussing general health topics. This slide is ideal for healthcare professionals presenting data on child health, vaccination rates, and BMI statistics, providing a concise overview of important metrics.
Text Placeholders & Capacity
Keep your copy within these limits so it fits without resizing. Text slots are spacious, allowing for detailed descriptions.
| Placeholder | Count | Max characters (approx.) |
|---|---|---|
| Slide title | 1 | 40 |
| Subtitle | 1 | 60 |
| Item body | 2 | 100 |
| Item heading | 2 | 30 |
| Chart title | 1 | 40 |
Slide Keywords
Download unlimited PowerPoint templates, charts and graphics for your presentations with our annual plan.
DOWNLOADReturn to Pediatrics PowerPoint Template.