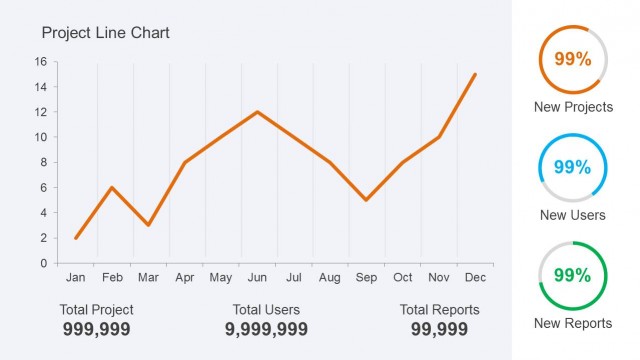
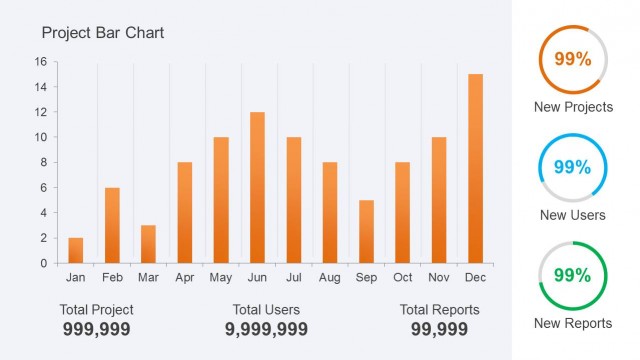
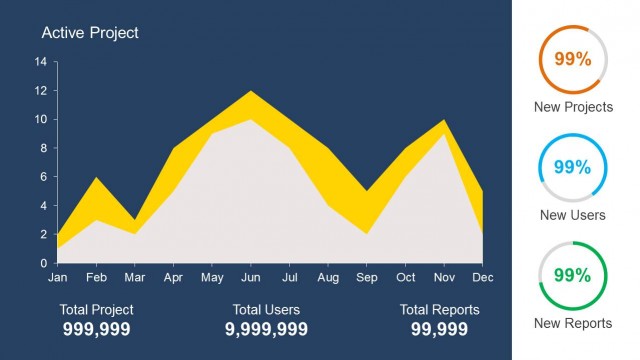
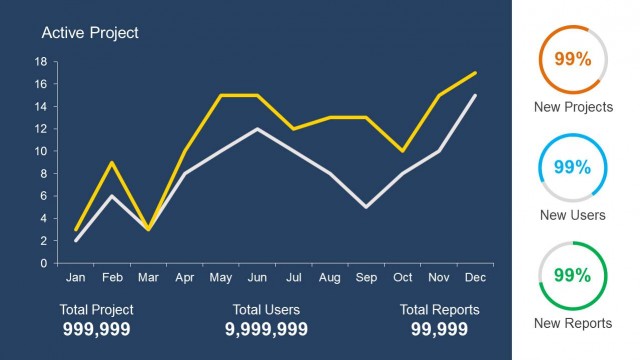
Orange Area Chart PowerPoint Template with KPI & Metrics
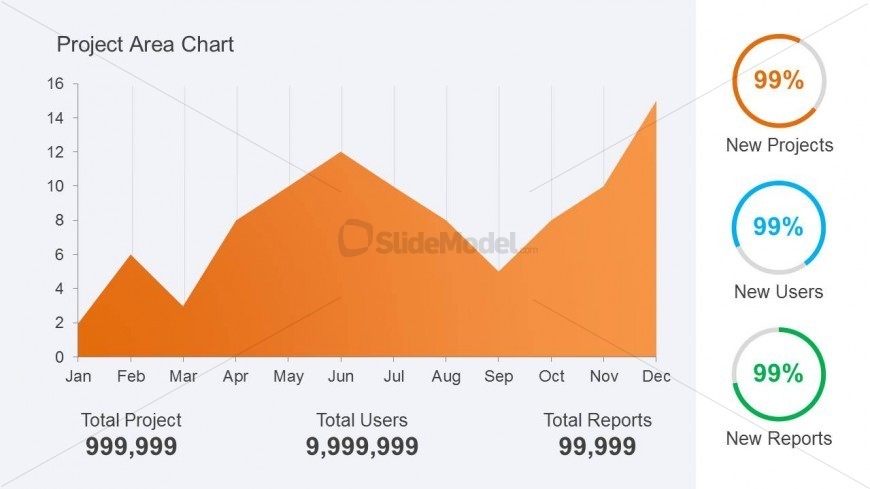
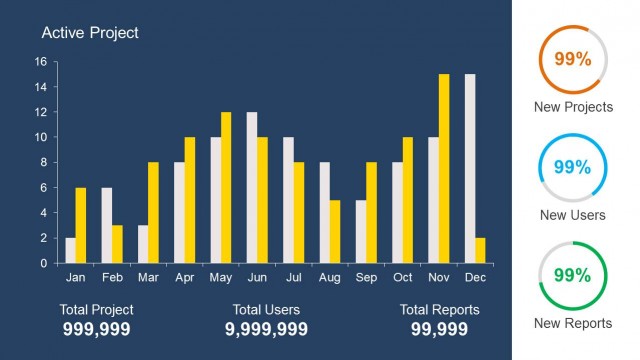
Orange Area Chart PowerPoint slide design showing a nice area chart with orange area background and three placeholders for KPI or key performance indicators. You can also display total numbers at the bottom of the slide design like in this example where we are showing a plceholder for Total Project number, Total Users and Total Reports.
Alternatively you can download other nice project management and dashboard PowerPoint templates including gauges and meters that you can use in your own slides.
Return to Orange Project Dashboard PowerPoint Template.