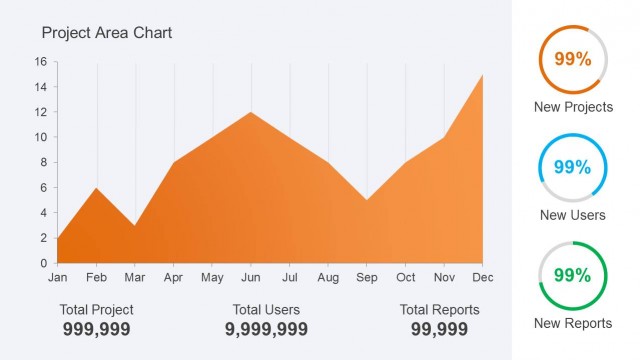
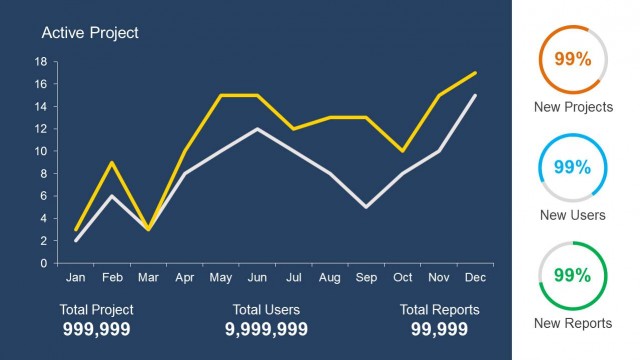
Orange Bar Chart PowerPoint Template with KPI & Metrics
Orange Bar Chart for PowerPoint presentations with months in the X-axis and 3 KPI indicators using donut charts at the right.
Return to Orange Project Dashboard PowerPoint Template.
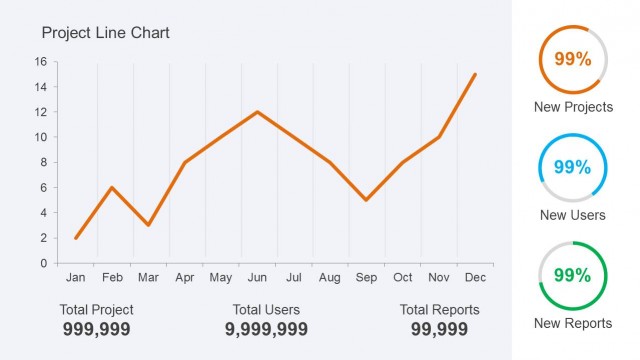
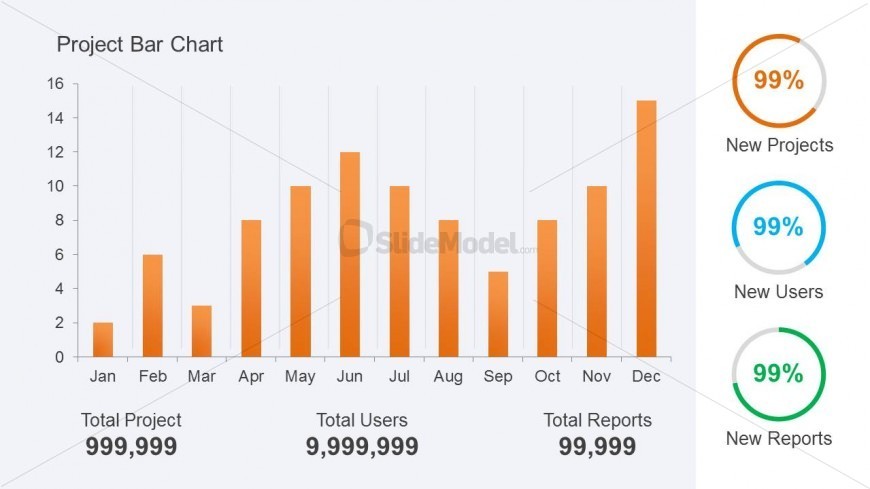
Orange Bar Chart for PowerPoint presentations with months in the X-axis and 3 KPI indicators using donut charts at the right.
Return to Orange Project Dashboard PowerPoint Template.