Slide 1 of 2 from Optimal Capital Structure Curve for PowerPoint
Optimal Capital Structure Curve Design for PowerPoint
Optimal Capital Structure Curve Diagram
- Diagram
- Other
- Concept Explanation Slide
- 16:9
- 100% Editable
The Optimal Capital Structure Curve slide from the Optimal Capital Structure Curve for PowerPoint template visually explains key finance concepts using a clear diagram. This slide layout is ideal for business presentations and educational finance topics, featuring editable shapes and vector icons to illustrate the relationship between convertible debt, bankruptcy costs, and firm value. It integrates seamlessly into corporate presentations or pitch deck templates focused on capital management strategies.
About This Slide
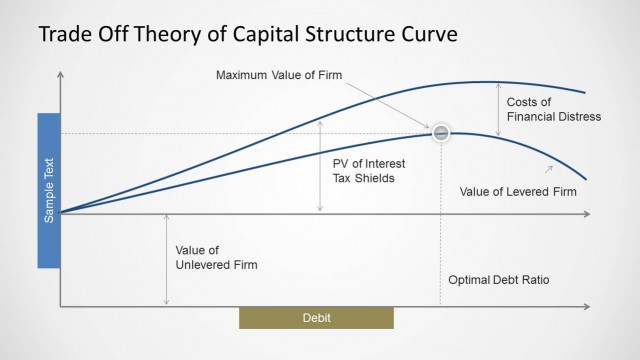
Optimal Capital Structure Curve Design for PowerPoint showing Maximum Value of Firm, Expected Taxes and Taxes paid due to existing equity.
What’s on This Slide
The slide features a curve diagram illustrating the optimal capital structure. The curve is positioned centrally, with axes labeled for present value and the optimal portion of convertible debt. The left vertical axis indicates percentages from 0% to 100%. The curve is divided into three sections, representing expected bankruptcy costs, maximum firm value, and expected taxes, with corresponding labels. A text placeholder is located on the left, vertically aligned, while another placeholder is at the bottom center. The background is light, enhancing clarity.
How to Use It
This layout serves as a visual representation of the optimal capital structure in finance. It fits well after problem framing slides, providing a clear depiction of how capital mix affects firm value. This diagram is useful for finance professionals discussing capital management strategies, risk assessment, and investment decisions. It can also aid in educational contexts, helping students understand complex financial theories about capital structure and its implications.
Text Placeholders & Capacity
Keep your copy within these limits so it fits without resizing. Text slots can accommodate concise phrases, roughly 5-10 words each.
| Placeholder | Count | Max characters (approx.) |
|---|---|---|
| Slide title | 1 | 30 |
| Item heading | 3 | 25 |
| Body paragraph | 1 | 50 |
Slide Keywords
Download unlimited PowerPoint templates, charts and graphics for your presentations with our annual plan.
DOWNLOAD