Slide 2 of 2 from Trade Off Theory of Capital Structure Curve for PowerPoint
6225-01-trade-off-theory-of-capital-structure-curve-2
Trade Off Theory of Capital Structure Curve
- Diagram
- Other
- Strategic Analysis Slide
- 16:9
- 100% Editable
The Capital Structure Curve Diagram from the Trade Off Theory of Capital Structure Curve for PowerPoint template provides a clear visual tool for finance presentations. This slide template effectively illustrates the trade-off theory, highlighting key firm value metrics and debt relationships. It is ideal for corporate presentations and investment strategy meetings requiring editable slides with vector icons to enhance clarity and engagement.
What’s on This Slide
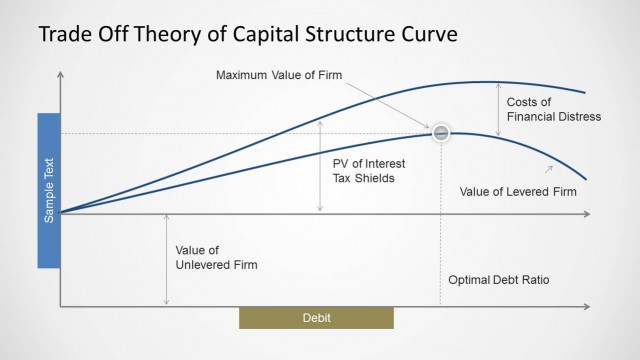
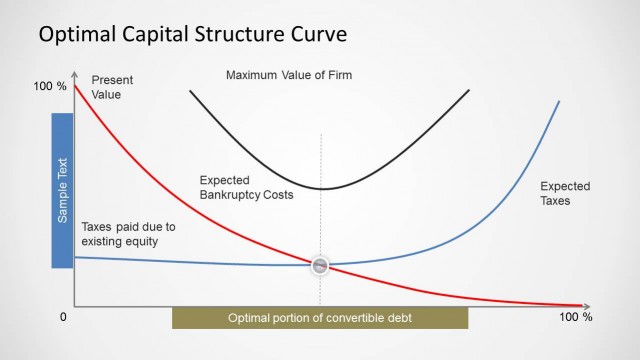
The layout features a curve illustrating the trade-off theory of capital structure. The curve is positioned centrally, with labels indicating maximum firm value, costs of financial distress, present value of interest tax shields, value of levered firm, and value of unlevered firm. The x-axis is labeled 'Debit' and the y-axis shows firm value metrics. There are text placeholders on the left and right sides, with the left containing a label and the right a sample text box. The background is light, enhancing the visibility of the curve and labels.
How to Use It
This diagram serves to visually represent the relationship between debt levels and firm value, making it suitable for finance presentations discussing capital structure. It fits well after a problem slide addressing financial distress costs, leading into discussions on optimal debt ratios. This layout is useful in scenarios where financial strategies are evaluated, such as investment planning or risk assessment discussions. It can also support educational contexts in finance courses focusing on capital management.
Text Placeholders & Capacity
Keep your copy within these limits so it fits without resizing. Node labels are tight, roughly 5-7 words each.
| Placeholder | Count | Max characters (approx.) |
|---|---|---|
| Slide title | 1 | 30 |
| Item heading | 5 | 25 |
| Body paragraph | 1 | 50 |
Slide Keywords
Download unlimited PowerPoint templates, charts and graphics for your presentations with our annual plan.
DOWNLOADReturn to Trade Off Theory of Capital Structure Curve for PowerPoint.