Slide 5 of 14 from Operational Excellence PowerPoint Template
The North Star Slide with Three Circles Diagram
Vision Diagram Slide for Presentations
- Diagram
- Venn
- Strategic Analysis Slide
- 16:9
- 100% Editable
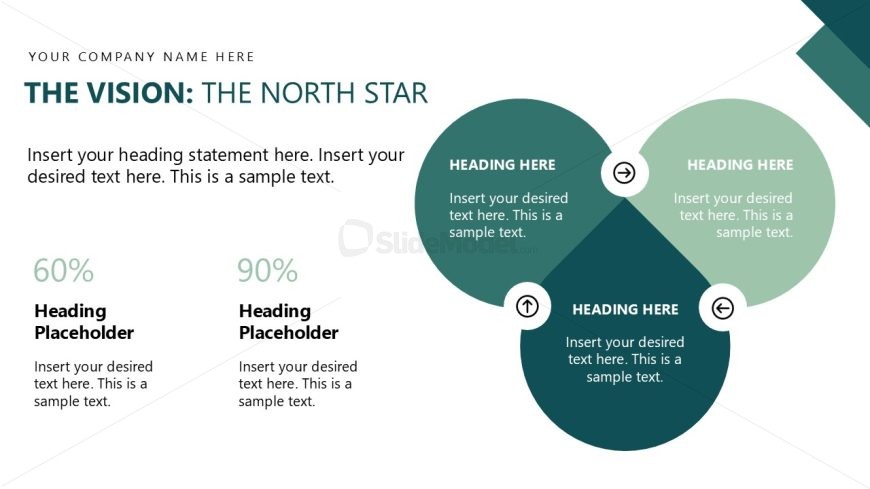
The Vision Diagram with Percentages slide from the Operational Excellence PowerPoint Template offers a clear visual tool for illustrating strategic objectives and performance metrics. This slide layout uses overlapping circles and percentage indicators to highlight relationships within a vision statement, making it ideal for business presentations and corporate slide decks. Its design supports effective communication of key operational goals using editable shapes and vector icons.
What’s on This Slide
The layout features three overlapping circles arranged in a triangular formation. Each circle contains a heading placeholder at the top and a text placeholder below it. The left circle displays a percentage of 60%, while the right circle shows 90%. The central area includes an arrow pointing towards the right, indicating a flow or connection between the circles. The background is a light color, providing contrast to the darker circle colors. The overall composition emphasizes visual hierarchy through size and positioning of the elements.
How to Use It
This layout serves as a visual representation of a vision statement or key performance indicators. It fits well in a presentation sequence after introducing a problem or goal, helping to outline strategic objectives. Real-world applications include corporate vision statements, project milestones, or performance metrics. It effectively communicates the relationship between different components of a vision or strategy, making it suitable for business contexts focused on operational excellence.
Text Placeholders & Capacity
Keep your copy within these limits so it fits without resizing. Node body slots can hold around 20-25 words each.
| Placeholder | Count | Max characters (approx.) |
|---|---|---|
| Item heading | 3 | 30 |
| Item body | 3 | 100 |
| Body paragraph | 1 | 150 |
| Slide title | 1 | 60 |
Slide Keywords
Download unlimited PowerPoint templates, charts and graphics for your presentations with our annual plan.
DOWNLOADReturn to Operational Excellence PowerPoint Template.