Slide 4 of 14 from Operational Excellence PowerPoint Template
The Current State Slide – Operational Excellence Presentation Template
Current State Analysis Bar Chart Slide
- Chart
- Bar Horizontal
- Evaluation Slide
- 16:9
- 100% Editable
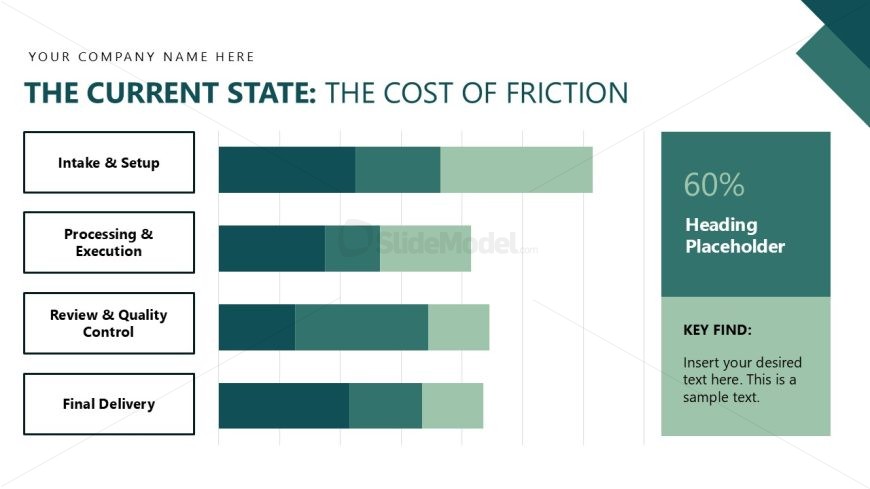
The Current State Analysis Bar Chart slide from the Operational Excellence PowerPoint Template offers a clear horizontal bar chart layout ideal for business presentations focused on performance reviews and operational assessments. This slide uses editable shapes and vector icons to highlight key friction points in workflows, making it a practical choice within slide decks that aim to evaluate and improve project execution efficiency.
What’s on This Slide
The layout features a horizontal bar chart with four distinct bars representing different stages: Intake & Setup, Processing & Execution, Review & Quality Control, and Final Delivery. Each bar is aligned left, with labels positioned vertically on the left side. A prominent heading at the top indicates 'THE CURRENT STATE: THE COST OF FRICTION.' To the right, a large text placeholder displays a percentage and a heading, with a smaller placeholder for additional key findings. The overall color scheme includes shades of teal and green, creating a cohesive visual hierarchy.
How to Use It
This layout serves as a comparative analysis tool, effectively illustrating the current state of operational processes. It fits within a presentation sequence after problem identification and before solution proposals. This slide is suitable for business scenarios such as performance reviews, operational assessments, or project evaluations, where stakeholders need to visualize areas of friction and inefficiency. It can be used to highlight specific challenges in workflows and guide discussions on improvement strategies.
Text Placeholders & Capacity
Keep your copy within these limits so it fits without resizing. Node labels can accommodate about 5-6 words each.
| Placeholder | Count | Max characters (approx.) |
|---|---|---|
| Slide title | 1 | 40 |
| Item heading | 4 | 30 |
| Item body | 1 | 100 |
| Chart title | 1 | 40 |
Slide Keywords
Download unlimited PowerPoint templates, charts and graphics for your presentations with our annual plan.
DOWNLOADReturn to Operational Excellence PowerPoint Template.