Slide 11 of 12 from SaaS Company PowerPoint Template
Financial Overview Slide with Data Visualizations
Financial Overview Slide for SaaS Presentation
- Chart
- Line Chart
- Financial Summary Slide
- 16:9
- 100% Editable
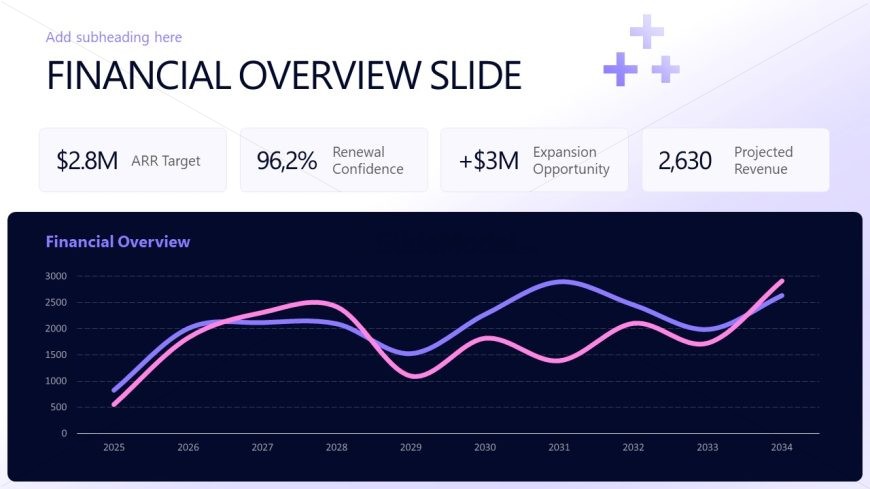
The Financial Overview Slide from the SaaS Company PowerPoint Template offers a clear layout for presenting revenue trends and financial data using editable slides. This slide template features a prominent line chart with dual data lines and text placeholders, making it suitable for business presentations and investment pitches that require detailed financial summaries and projections.
What’s on This Slide
The layout features a top section with a title and four text placeholders aligned horizontally. The title is positioned at the top center, while the placeholders are arranged in a row beneath it, with varying sizes. Below, a line chart occupies the majority of the slide, displaying two colored lines representing financial data over time. The x-axis indicates years from 2025 to 2034, and the y-axis shows revenue figures. The background is a gradient transitioning from light to dark, enhancing visual contrast. The overall structure emphasizes the chart as the focal point.
How to Use It
This layout serves to present financial data and projections, ideal for highlighting key metrics in a business context. It fits well after a market analysis slide, providing a clear transition to financial performance. Use this slide to communicate revenue targets, growth opportunities, and renewal confidence. It is suitable for quarterly business reviews or investor presentations, where financial insights are critical for decision-making.
Text Placeholders & Capacity
Keep your copy within these limits so it fits without resizing. Body slots are tight, roughly 4-5 words each.
| Placeholder | Count | Max characters (approx.) |
|---|---|---|
| Slide title | 1 | 30 |
| Body paragraph | 4 | 20 |
| Chart title | 1 | 20 |
Slide Keywords
Download unlimited PowerPoint templates, charts and graphics for your presentations with our annual plan.
DOWNLOADReturn to SaaS Company PowerPoint Template.