Showcase your framework to solve complicated business problems or risk mitigation measures in executive presentations with our Key Challenges Strategy Outcome PowerPoint Template. Organizations regularly face challenges for which they develop relevant strategies to overcome these stresses and streamline processes. For quarterly review presentations, this template helps business consultants showcase strategies for addressing challenges and improving the company’s system. They can highlight the ways to overcome roadblocks in the business development process. Project managers use the three-column layout to discuss the challenges faced during the process, strategies to overcome them, and the outcomes achieved. This helps stakeholders and executive members understand the teams’ expertise for future endeavors.
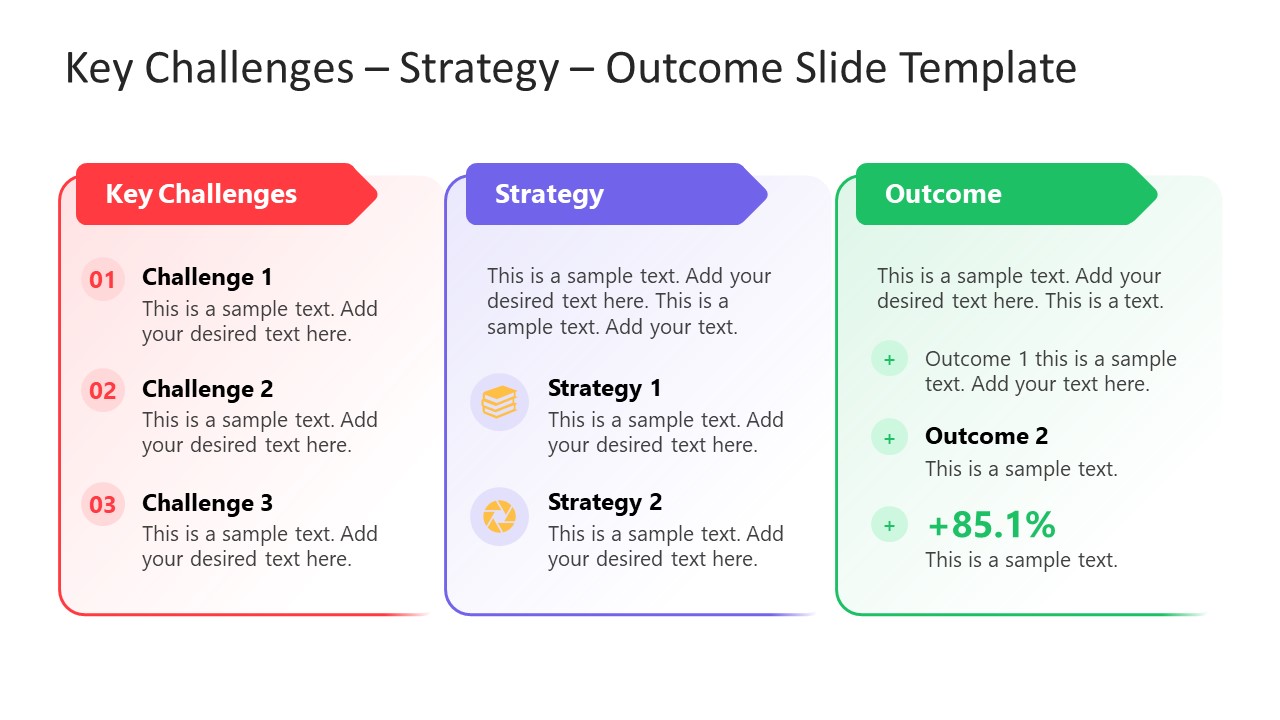
The Key Challenges Strategy Outcome PowerPoint Template features a single-slide layout with three vertical segments. At the top, product directors use arrow shapes to show the headings. Financial experts use the template to discuss revenue issues or tax losses and outline ways to maximize tax savings and profit growth. In RCA presentations, this template allows operational directors to pinpoint workflow irregularities and their relevant solutions. The red color of the challenges section and the green in the outcomes section illustrate the concept in a color-coded format. This helps the audience understand better.
All sections have multiple corresponding bullet points to present the data in an ordered format. Further, we allow professionals to change the colors and icons to match their theme, or you can repurpose it to discuss other business models or three-step processes. Download the key challenges strategy outcome PPT template for your executive decision presentations and discuss problem-solution narratives with structure and clarity.
What’s inside this template
Example presentation scenarios
- A project manager can use the numbered challenge list to summarize delivery blockers, then connect each issue to strategy notes and outcome bullets for a stakeholder review.
- A business consultant can present a client problem-solving framework by showing the red challenge panel, purple strategy panel, and green outcome panel as a concise executive narrative.
- An operations director can explain workflow irregularities, corrective actions, and improvement results using the three vertical panels and icon-supported strategy callouts.
- A finance manager can outline revenue risks or cost issues, proposed mitigation actions, and a result such as a percentage improvement in the outcome section.
Features
- 100% editable presentation template
- Compatible with Microsoft PowerPoint and Google Slides
- 16:9 aspect ratio slides
- Scalable vector shapes, icons and illustrations
- AI-Ready for Microsoft Copilot and Claude
- Instant access and download
Frequently asked questions
Q: How should a presenter communicate the message on this slide?
A: Start with the red challenge column and keep each issue short enough to scan. Move to the purple strategy column to explain the selected response, not every possible option. Close on the green outcome column with the strongest proof point, such as the percentage callout, so the audience sees cause, action, and result in order.
Q: Who benefits most from using this challenge-strategy-outcome format?
A: This template fits presenters who need to brief decision makers quickly: consultants, project managers, operations leads, product directors, and finance managers. It works best when the story already has a clear before-and-after structure, such as a project issue, corrective strategy, and measurable or qualitative result.
Q: Why does the three-column design improve the explanation?
A: The design uses a left-to-right logic path that mirrors how executives evaluate business action: problem, response, and impact. Color coding reinforces the metaphor, with red marking friction, purple separating the plan, and green signaling progress. The arrow headers and rounded panels make each stage distinct without breaking the flow.
Key Challenges Strategy Outcome PowerPoint Template
1-slide presentation template for key challenges, strategy actions, and outcome reporting discussions
This is a 1-slide strategy diagram for framing business problems, response plans, and results. The slide uses a three-column challenge-strategy-outcome layout, numbered challenge list, strategy icon callouts, and outcome bullets with a percentage highlight. It is built for managers and consultants in Microsoft PowerPoint and Google Slides.
- Category
- Diagrams
- Rating

 Loading...
- Aspect ratio
- 16:9
- Item ID
- 94200-01
- Colors
 Microsoft PowerPoint
  Microsoft Copilot
  Claude for PowerPoint
 Other formats supported
Subscribe today and get immediate
access to download our PowerPoint templates.