Slide 11 of 13 from Investment Opportunity Assessment PowerPoint Template
Scenario & Sensitivity Slide – Investment Opportunity Assessment Presentation Layout
Scenario & Sensitivity Analysis Slide
- Table
- Comparison Table
- Financial Summary Slide
- 16:9
- 100% Editable
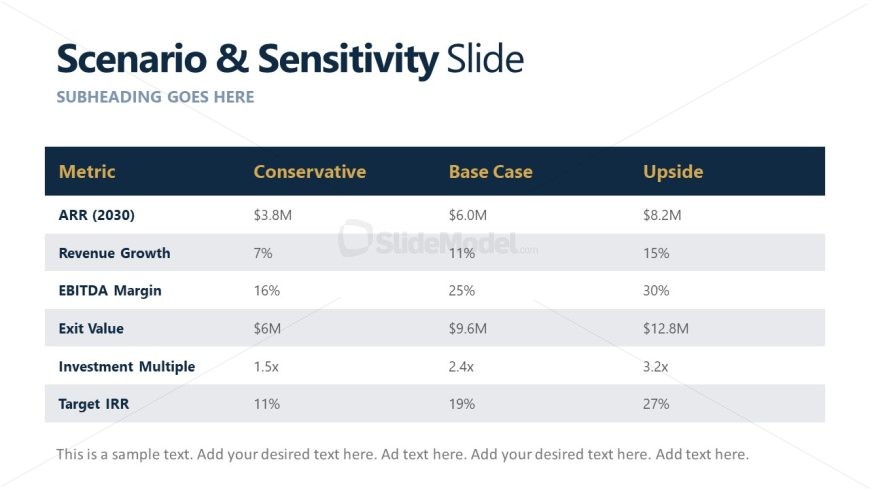
The Scenario & Sensitivity Analysis slide from the Investment Opportunity Assessment PowerPoint Template offers a clear table layout for comparing financial metrics across Conservative, Base Case, and Upside scenarios. This slide is designed for business presentations that require detailed financial scenario analysis, making it a useful component in pitch deck templates and corporate presentations focused on investment evaluation and risk assessment.
What’s on This Slide
The layout features a table positioned centrally, containing five rows and four columns. The first column lists metrics, while the subsequent columns display values for Conservative, Base Case, and Upside scenarios. Each cell is aligned to the center, with bold headers for the columns. Text placeholders are present for a title at the top and a subheading below it. The background is light with dark blue accents, creating a clear visual hierarchy. The overall composition is structured for easy comparison of metrics across scenarios.
How to Use It
This layout serves as a comparative analysis tool, ideal for presenting different financial scenarios. It fits well after problem-framing slides, providing clarity on potential outcomes. Commonly used in investment assessments, it helps stakeholders understand risks and returns. The table format allows for quick visual reference, making it suitable for discussions on investment strategies and financial forecasting.
Text Placeholders & Capacity
Keep your copy within these limits so it fits without resizing. Node labels can hold about 5 words each, while body slots are tight, roughly 2 words each.
| Placeholder | Count | Max characters (approx.) |
|---|---|---|
| Slide title | 1 | 30 |
| Item heading | 5 | 25 |
| Item body | 15 | 10 |
Slide Keywords
Download unlimited PowerPoint templates, charts and graphics for your presentations with our annual plan.
DOWNLOADReturn to Investment Opportunity Assessment PowerPoint Template.