Slide 12 of 13 from Investment Opportunity Assessment PowerPoint Template
Risk & Alternative Investment Comparison Slide with Graphical Icons
Risk & Alternative Investment Comparison Slide
- Chart
- Bubble Chart
- Strategic Analysis Slide
- 16:9
- 100% Editable
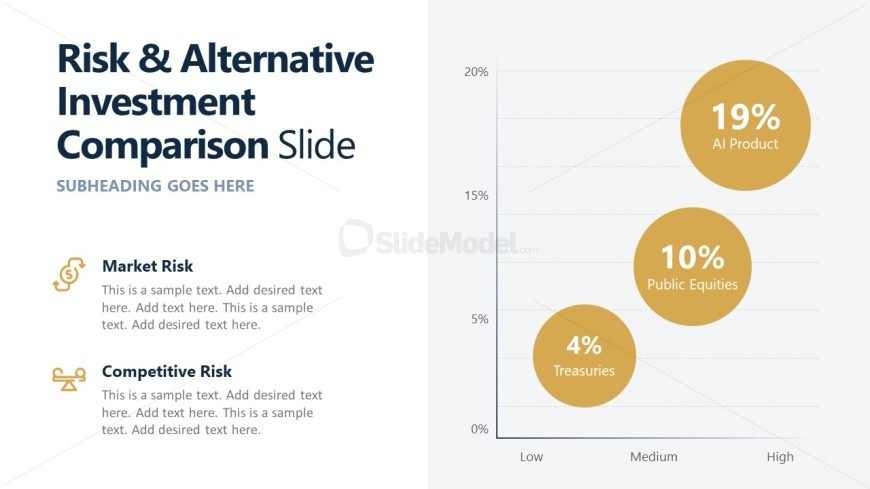
The Risk & Alternative Investment Comparison slide from the Investment Opportunity Assessment PowerPoint Template offers a clear visual layout combining a vertical bar chart and risk analysis sections. This slide template is designed for strategic financial presentations, enabling effective communication of market and competitive risks alongside investment type comparisons. Its editable shapes and vector icons support detailed business presentations and pitch deck templates focused on investment strategy discussions.
What’s on This Slide
The layout features a vertical bar chart on the right, showing three investment types: AI Product, Public Equities, and Treasuries, each represented by circular nodes. The chart has a y-axis labeled with percentage values from 0% to 20%. On the left, there are two sections labeled 'Market Risk' and 'Competitive Risk,' each with a corresponding icon and text placeholders below them. The title is prominently displayed at the top, with a subheading below it. The overall composition balances text and visual elements, creating a clear distinction between the risks and the investment comparison.
How to Use It
This layout serves as a comparative analysis of investment risks, ideal for discussions on investment strategies. It fits well after problem framing slides, providing a visual representation of risk levels associated with different investment types. This slide is beneficial for financial presentations, investment proposals, or strategy meetings where stakeholders assess market opportunities and risks. It allows for easy communication of complex data in a structured format, making it suitable for both internal and external presentations.
Text Placeholders & Capacity
Keep your copy within these limits so it fits without resizing. Node body slots can hold approximately 150 characters each, allowing for detailed descriptions.
| Placeholder | Count | Max characters (approx.) |
|---|---|---|
| Slide title | 1 | 30 |
| Subtitle | 1 | 30 |
| Item heading | 3 | 20 |
| Item body | 3 | 150 |
Slide Keywords
Download unlimited PowerPoint templates, charts and graphics for your presentations with our annual plan.
DOWNLOADReturn to Investment Opportunity Assessment PowerPoint Template.