Slide 5 of 7 from Income Statement PowerPoint Template
Area Chart for Income Statement PowerPoint Template
Area Chart Slide for Financial Presentations
- Chart
- Area Chart
- Financial Summary Slide
- 16:9
- 100% Editable
The Area Chart with Annotations slide from the Income Statement PowerPoint Template offers a clear visualization of financial trends using editable slides. This layout supports detailed quarterly revenue reports and annual performance reviews, featuring vector icons and customizable text placeholders to highlight key data points effectively within a business presentation or pitch deck template.
What’s on This Slide
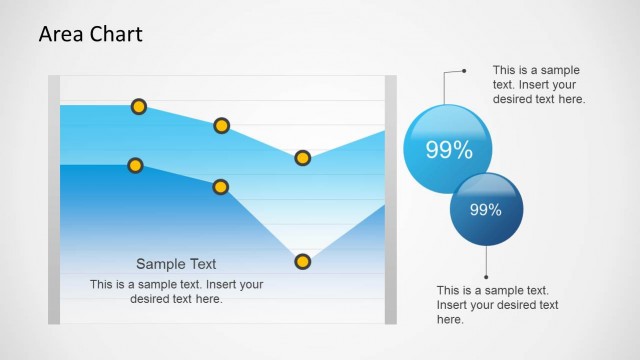
The slide features an area chart positioned centrally, depicting data trends over time. The chart is shaded in blue, with a gradient effect from light to dark. Above the chart, there are five text placeholders aligned vertically, each labeled 'Sample Text' and positioned above red circular markers that indicate data points. The x-axis is labeled with years, while the y-axis displays numerical values. A light world map serves as the background, enhancing the overall visual context. The grid layout is subtle, providing a structured appearance.
How to Use It
This layout serves as a data visualization tool, ideal for presenting financial trends over time. It fits well after introductory slides that outline revenue or expenses, allowing for a deeper analysis of financial performance. This slide is suitable for finance teams to illustrate cash flow trends or revenue growth. It can be used in quarterly reviews or annual reports to highlight key financial metrics visually.
Text Placeholders & Capacity
Keep your copy within these limits so it fits without resizing. Node labels can accommodate about 20 characters each.
| Placeholder | Count | Max characters (approx.) |
|---|---|---|
| Chart title | 1 | 30 |
| Item heading | 5 | 20 |
| Item body | 5 | 30 |
Slide Keywords
Download unlimited PowerPoint templates, charts and graphics for your presentations with our annual plan.
DOWNLOADReturn to Income Statement PowerPoint Template.