Our Impact Effort Matrix Template for PowerPoint features an editable diagram slide to discuss the project plan’s low and high-impact tasks. The impact effort matrix is a valuable tool for project managers to segregate different tasks according to their relative importance toward the central goal. The company can optimize its budget allocation by applying this matrix to business tasks. Prioritizing specific steps in the process also results in better outcomes in financial terms. So, this impact effort matrix is frequently applied in tricky situations, planning, and problem-solving. Users can use this matrix template according to their requirements. All segments are 100% editable and are compatible with all PowerPoint versions, Google Slides & Keynote.
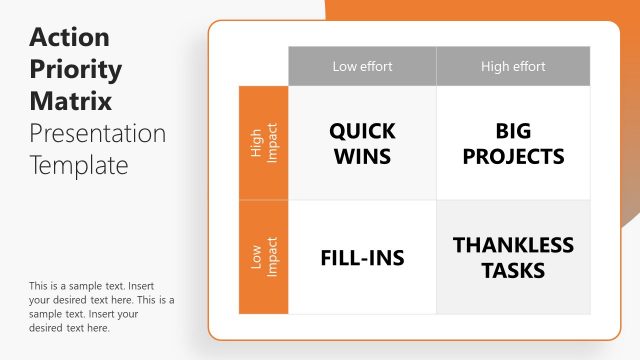
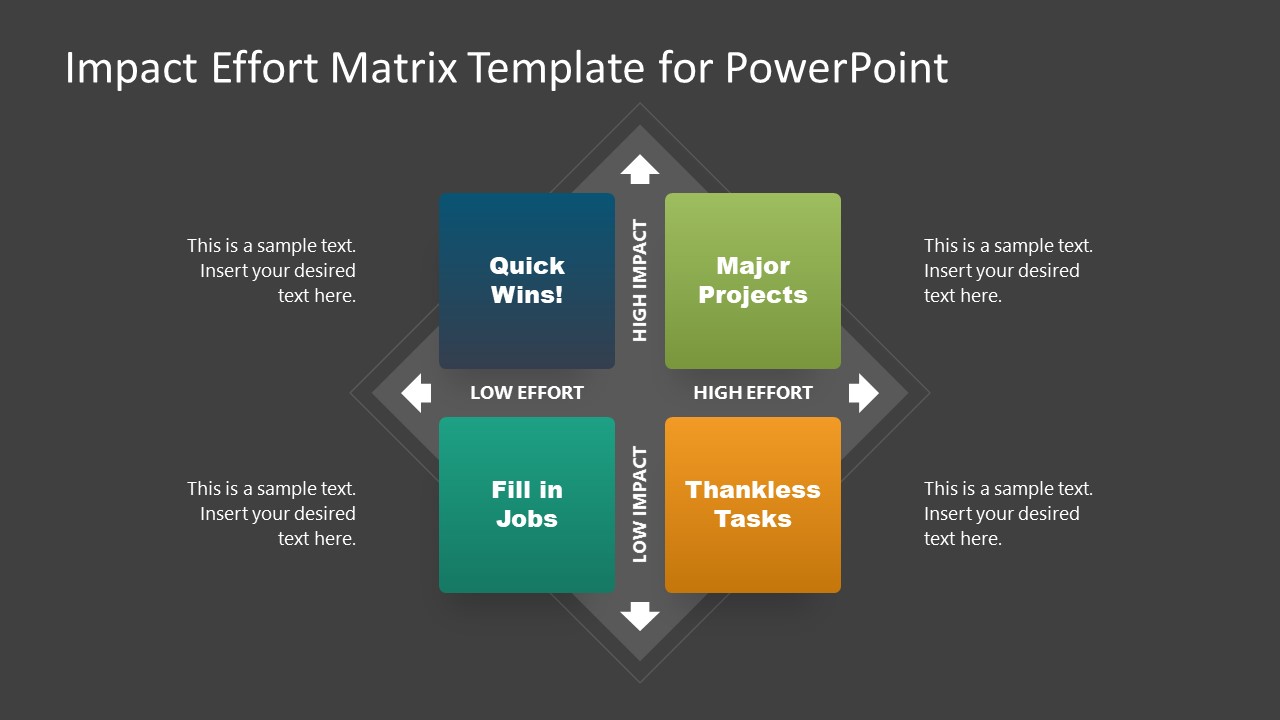
The Impact Effort Matrix Template for PowerPoint is a one-pager template provided in two background color options. Users can either choose from these slides or change the color scheme accordingly. The diagram template is a diamond shape having four segments along the perpendicular axis. Along the vertical center, the high and low impact variation is represented. Similarly, on the horizontal axis, the effort parameter is shown. The four quadrants are to mention the tasks:
- Quick wins: high-impact & low effort
- Major projects: high impact & high effort
- Fill in jobs: low impact & low effort
- Thankless tasks: low impact & high effort
Presenters can use the editable text boxes to mention their project tasks in these categories. This way, the task can be aligned concerning their ease and impact. Likewise, presenters can express their point of view before the management, investors, or stakeholders in a direct way. The arrowheads are used at the corners to communicate the trends of the parameters. Presenters can alter the titles and font styles. Also, the diagram can be copied to other destinations. Grab this impact effort matrix template and conveniently prepare your business project presentations.
What’s inside this template
Example presentation scenarios
- A project manager can use the four-quadrant matrix to sort a task list into Quick Wins, Major Projects, Fill in Jobs, and Thankless Tasks before confirming the next sprint or project phase.
- A product manager can present roadmap trade-offs to executives by placing candidate initiatives against the visible impact and effort axes and explaining the reasoning in the side callouts.
- A consultant can guide a client workshop by filling each quadrant live, then using the matrix labels to separate fast-value actions from work that needs more budget or timing review.
- An operations leader can compare improvement ideas with stakeholders by showing which actions have high impact, which require high effort, and which items should be delayed or dropped.
Features
- 100% editable presentation template
- Compatible with Microsoft PowerPoint and Google Slides
- 16:9 aspect ratio slides
- Scalable vector shapes, icons and illustrations
- AI-Ready for Microsoft Copilot and Claude
- Instant access and download
Frequently asked questions
Q: How should a presenter explain the matrix without overloading the audience?
A: Start with the two axes before naming the tasks. Explain that impact rises vertically and effort increases horizontally, then walk through the four quadrants in a practical order: Quick Wins first, Major Projects second, Fill in Jobs third, and Thankless Tasks last. Keep the side callouts for evidence, decision criteria, or next steps rather than long task descriptions.
Q: What type of decision is this template best suited for?
A: This template works best when a team must choose what to do next from a list of possible actions. It fits project planning, product backlog review, operational improvements, and budget prioritization meetings where stakeholders need a shared view of work that is valuable, easy, costly, or low return.
Q: Why does the diamond-shaped quadrant design help communicate prioritization?
A: The diamond frame and arrowheads make the two decision forces visible at a glance: impact moves up and effort moves across. The colored blocks separate choices into memorable categories, so the audience can compare options spatially instead of reading a list. This improves discussion because every task has a clear position and implication.



Impact Effort Matrix Template for PowerPoint
2-slide impact effort matrix presentation template with quadrants, effort axis and project prioritization labels
This 2-slide matrix template for Microsoft PowerPoint and Google Slides presents project tasks in an impact effort matrix. It includes a four-quadrant decision chart, high and low impact axis arrows, low and high effort labels, and side text callouts for explaining Quick Wins, Major Projects, Fill in Jobs, and Thankless Tasks.
- Category
- Matrix Charts
- Rating

 Loading...
- Aspect ratio
- 16:9
- Item ID
- 21746-01
- Colors
 Microsoft PowerPoint
 Microsoft Copilot
 Claude for PowerPoint
Other formats supported
Subscribe today and get immediate
access to download our PowerPoint templates.