Slide 6 of 14 from Formal Executive Briefing PowerPoint Template
KPI Presentation Slide Template
Key Metrics Dashboard for Business Overview
- Chart
- Line Chart
- Kpi Reporting Slide
- 16:9
- 100% Editable
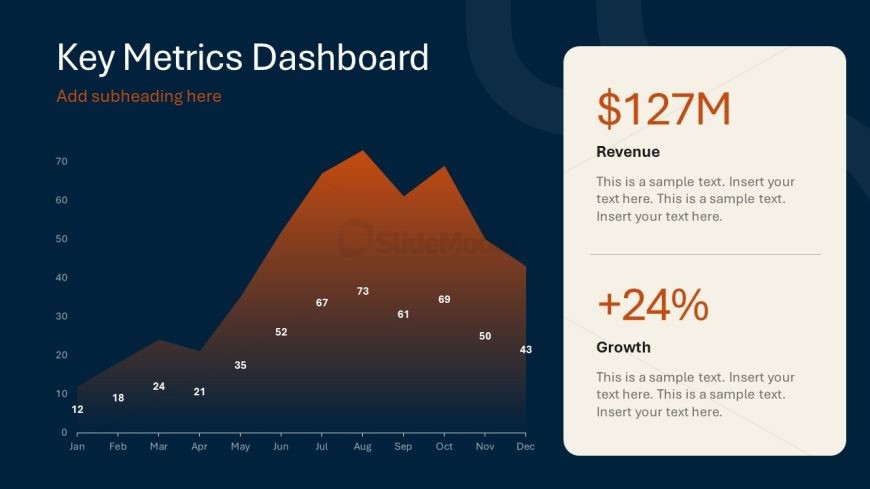
The Key Metrics Dashboard slide from the Formal Executive Briefing PowerPoint Template offers a clear layout for presenting financial performance and growth data. Designed for business presentations, this slide uses editable shapes and a line chart to visualize key indicators, making it suitable for quarterly reports and executive summaries within a corporate presentation or pitch deck template.
What’s on This Slide
The slide features a line chart positioned on the left, displaying key metrics over months. The chart has a gradient fill from orange to dark, with data points labeled. On the right, there are two text placeholders for 'Revenue' and 'Growth', each with a bold number and description below. The title is at the top left, and a subtitle placeholder is directly beneath it. The background is a dark blue, enhancing contrast with the chart and text. Overall, elements are balanced, with a clear visual hierarchy.
How to Use It
This layout serves as a KPI dashboard, summarizing key business metrics. It fits well after problem identification slides, providing a visual representation of performance. Use it to present financial data, growth statistics, or operational metrics in executive briefings. This slide is suitable for business reviews, quarterly reports, or strategic planning sessions, where concise data representation is essential.
Text Placeholders & Capacity
Keep your copy within these limits so it fits without resizing. Body slots can hold about 15-20 words each.
| Placeholder | Count | Max characters (approx.) |
|---|---|---|
| Slide title | 1 | 30 |
| Subtitle | 1 | 50 |
| Body paragraph | 2 | 100 |
| Item heading | 2 | 10 |
| Item body | 2 | 100 |
Slide Keywords
Download unlimited PowerPoint templates, charts and graphics for your presentations with our annual plan.
DOWNLOAD