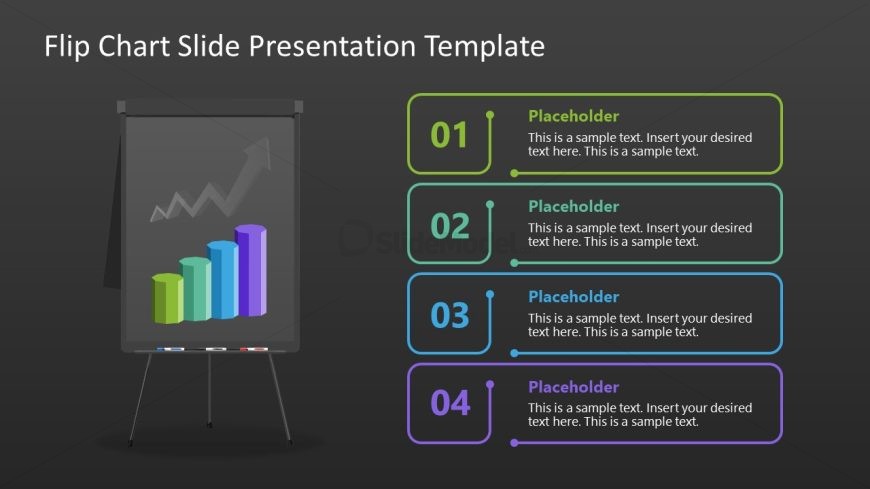
Slide 2 of 2 from Flip Chart PowerPoint Template
Customizable Flip Chart PPT Template
Dynamic Flip Chart Data Visualization Slide
- Chart
- Bar Vertical
- Data Visualization Slide
- 16:9
- 100% Editable
The Flip Chart with Data Bars slide from the Flip Chart PowerPoint Template offers a clear and professional way to visualize data trends in business presentations. This slide layout features editable shapes and colored bars ideal for quarterly reports, performance reviews, or market analysis. Its design supports effective communication of key metrics within corporate presentations and pitch deck templates, making it a practical choice for showcasing vertical bar charts in slide decks.
What’s on This Slide
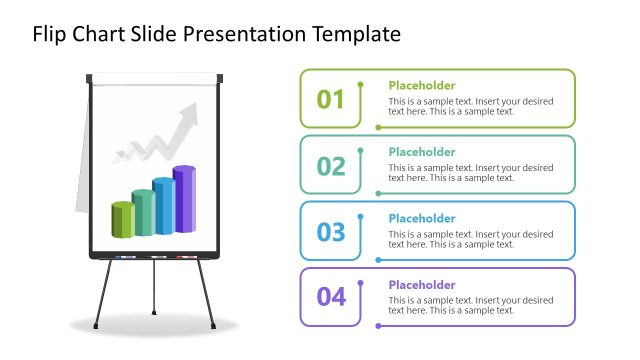
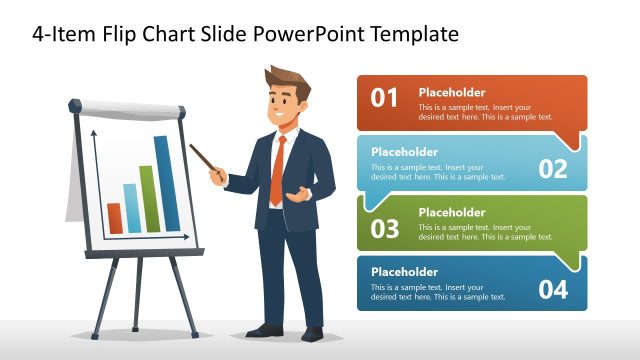
The slide features a central flip chart displaying a bar chart with four colored bars, arranged vertically. Each bar is a different color, transitioning from green to blue, purple, and teal. Above the chart, there is a title placeholder aligned to the top center. Below the chart, four numbered text placeholders are arranged vertically, each with a colored border matching the corresponding bar. The placeholders are aligned left, with ample space for text. The background is dark, enhancing the visibility of the chart and text elements.
How to Use It
This layout serves as a data visualization tool, ideal for presenting trends or insights in a business context. It fits well in a presentation sequence following an introduction or problem statement, providing a clear visual representation of data. This slide is suitable for scenarios such as quarterly reports, performance reviews, or market analysis discussions, where visual data representation is crucial for audience understanding.
Text Placeholders & Capacity
Keep your copy within these limits so it fits without resizing. Text slots can accommodate concise phrases, roughly 5-10 words each.
| Placeholder | Count | Max characters (approx.) |
|---|---|---|
| Slide title | 1 | 40 |
| Item heading | 4 | 30 |
| Item body | 4 | 100 |
Slide Keywords
Download unlimited PowerPoint templates, charts and graphics for your presentations with our annual plan.
DOWNLOADReturn to Flip Chart PowerPoint Template.