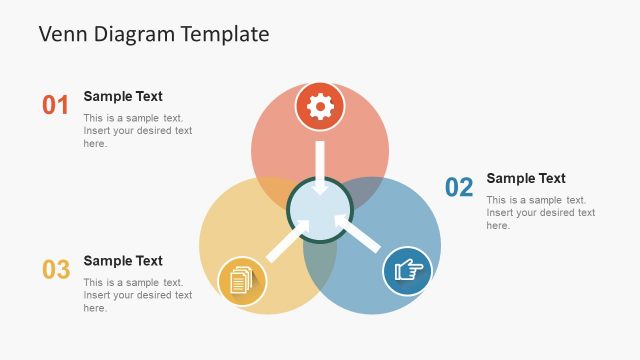
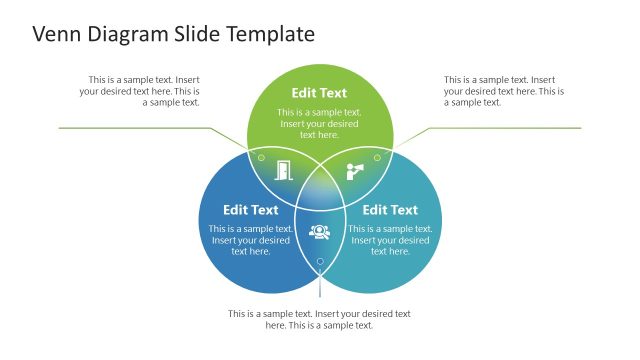
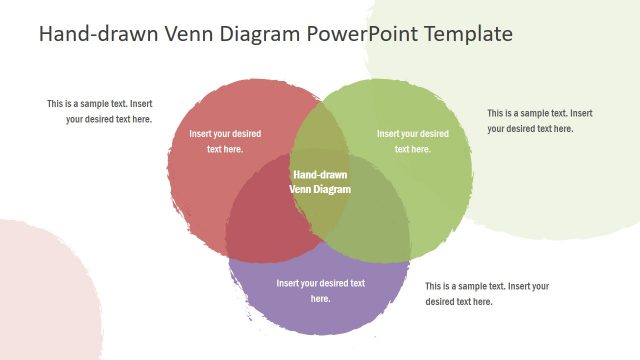
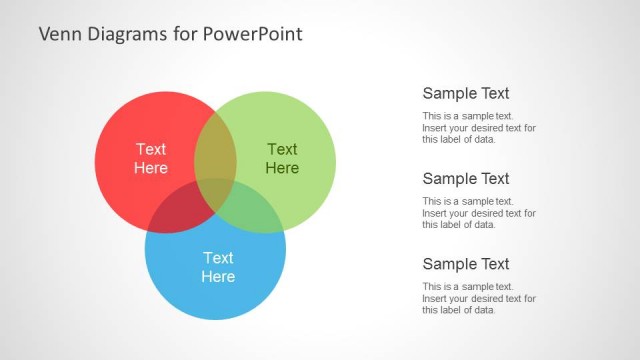
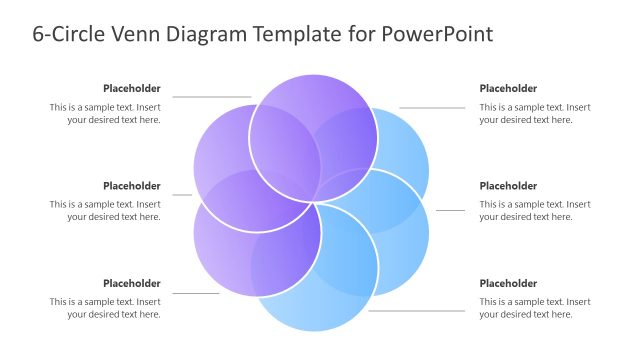
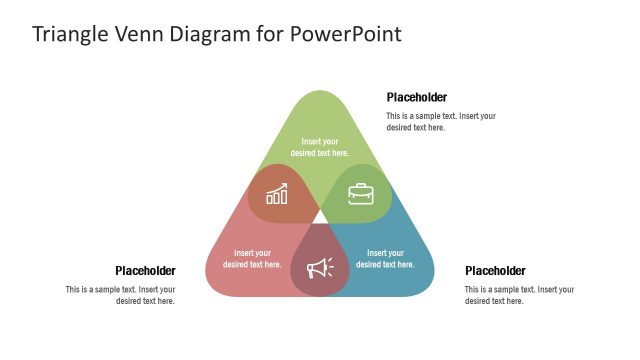
The Flat Venn Diagram Intersection Icons PowerPoint Template is a professionally designed Venn diagram model that consists a generic Venn diagram with three sets. Venn diagrams were invented in the late 1880s by John Venn as a way of easily demonstrating to audiences the logical relationships between seemingly unrelated ‘sets’ of different groups of things. This template is perfect of any professional presenter looking to illustrate to their audience the points at which three subjects, products or demographics meet on a spectrum.
This template offers a great visualisation tool that you can use in a variety of unique and interesting ways to illustrate to your lecture attendees the relationships between three sets or groups. It provides a simple means for professional PowerPoint presenters to create quality and intuitive graphics for their presentations and indicate relevant correlations between groups or illustrate the intersections between these groups. You might use this presentation template in school classes, university lectures, marketing seminars, business seminars or for any other reason. Some simple sets that you might consider using with this professional PowerPoint template to demonstrate the relationship between:
- small and furry animals against large and scaly animals and medium flying animals
- characters that are shared by the Latin, Greek and Cyrillic alphabets
- three separate marketing demographics that you intend to market a particular product towards
- the point at which responses from a random sample vox populi correlate
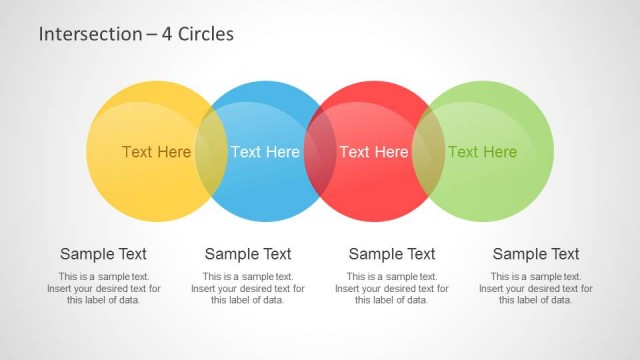
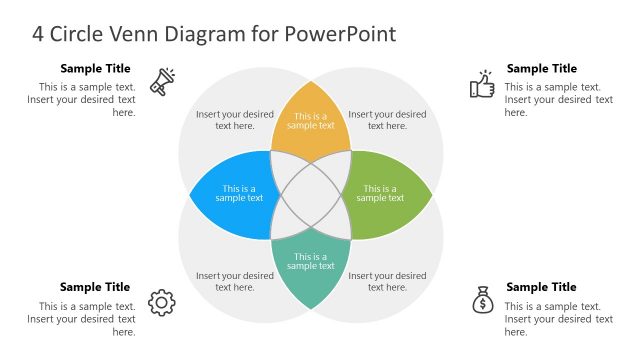
Like all of the professionally designed PowerPoint templates offered by SlideModel, this design is fully customizable and editable. All shapes, icons and text boxes are created from high quality clip art icons that are available in your own data bank, so you can customize this template to ensure that it meets your own specific requirements for your presentation. Super flexible, it’s great for all. Alternatively, you can download a 4 circle Venn diagram for PowerPoint.
What’s inside this template
Example presentation scenarios
- A marketing presenter can compare three customer segments and use the 3-circle Venn diagram to show where their behaviors or needs intersect.
- An educator can introduce set theory or category relationships with the numbered Venn slide and then reinforce each set using the three icon cards.
- A product manager can map shared features across three offerings with the segmented intersection diagram and use surrounding callouts to explain tradeoffs.
- A consultant can simplify stakeholder alignment by placing each group in one circle and using the central overlap to frame a shared priority.
Features
- 100% editable presentation template
- Compatible with Microsoft PowerPoint and Google Slides
- 16:9 aspect ratio slides
- Scalable vector shapes, icons and illustrations
- AI-Ready for Microsoft Copilot and Claude
- Instant access and download
Frequently asked questions
Q: How should a presenter explain the three-set comparison without making the Venn diagram feel crowded?
A: Start with the numbered 3-circle Venn slide and assign one clear idea to each circle before discussing intersections. Keep each callout short, then use the segmented icon slide to explain the overlap in plain language. Reserve the center overlap for the main conclusion, not for extra detail.
Q: For what kind of presentation is this Venn diagram template the best fit?
A: This template works best when a presenter needs to compare three related categories and show what they share. It fits marketing segmentation, product positioning, curriculum examples, and consulting workshops. It is less suitable for ranking options or showing time-based progress, because its strength is relationship mapping.
Q: Why do the overlapping circle and petal-style layouts improve the comparison message?
A: The Venn metaphor makes shared space visible, so the audience can see difference and overlap at the same time. The petal-style version adds icons to make each set easier to remember. The final three-card layout separates the same ideas into individual summaries when the presenter needs a cleaner recap.


Flat Venn Diagram Intersection Icons
4-slide Venn diagram presentation template with intersection icons and comparison cards for PowerPoint and Google Slides
Flat Venn Diagram Intersection Icons is a 4-slide diagram template for comparing three sets and their intersections. It includes a labeled 3-circle Venn diagram, a segmented intersection icon diagram, a dark-background Venn variation, and three icon cards. Built for business, education, and marketing presenters in Microsoft PowerPoint and Google Slides.
- Category
- Diagrams
- Rating


 Loading...
- Aspect ratio
- 16:9, 4:3
- Item ID
- 6643-01
- Colors
 Microsoft PowerPoint
 Microsoft Copilot
 Claude for PowerPoint
Other formats supported
Subscribe today and get immediate
access to download our PowerPoint templates.