Flat Colorful Dashboard Speedometer
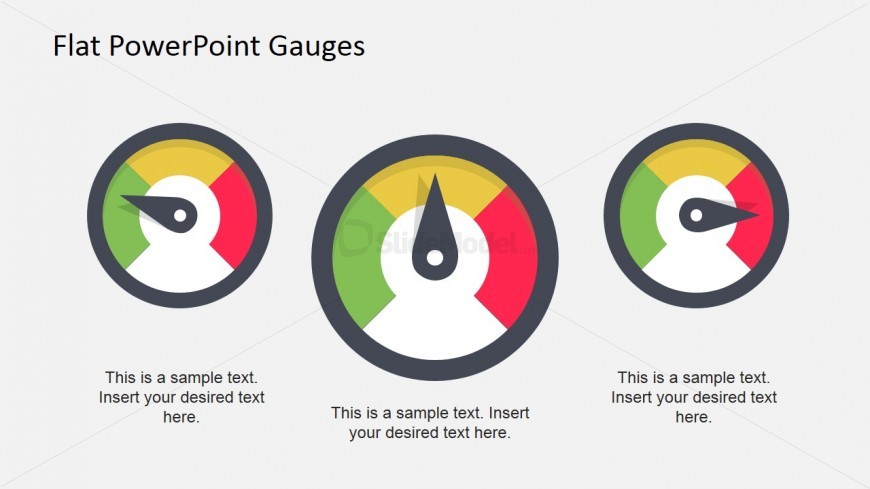
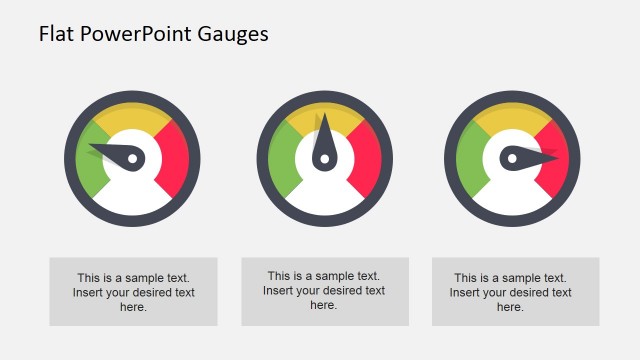
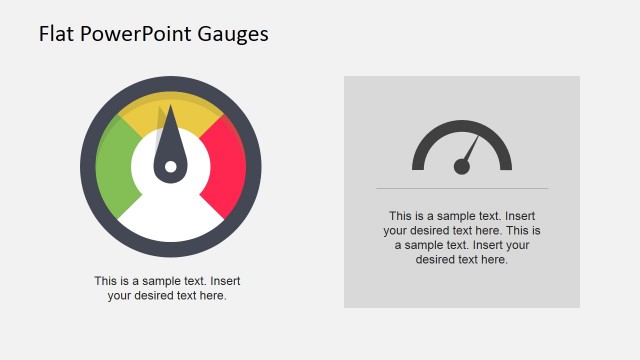
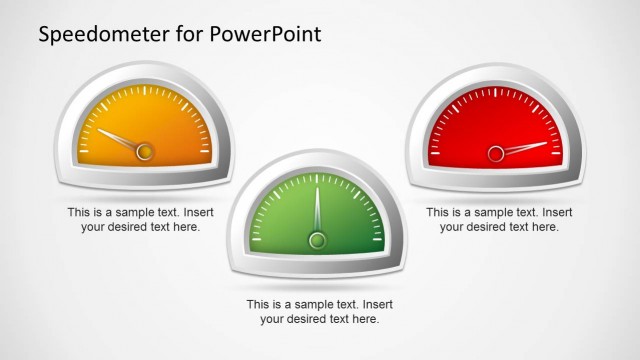
A Flat Colorful Dashboard Speedometer is showcased in the PowerPoint slide. It can be used in business presentations to show the relative levels of progress in three different elements of a business plan. The speedometer can be utilized as a gauge, with the three colored segments representing different states of the plan.
The presentation design contains three vector drawings of speedometers. Their pointers are arranged to point at different segments of the speedometers. Text placeholders are provided for each speedometer, so that the presenter can include descriptions. The PowerPoint objects are 100% editable. Modify them depending on the need of the presenter.
Return to Flat Dashboard Gauges for PowerPoint.
Download unlimited PowerPoint templates, charts and graphics for your presentations with our annual plan.
DOWNLOADReturn to Flat Dashboard Gauges for PowerPoint.
