Bar Chart Flat Design for PowerPoint
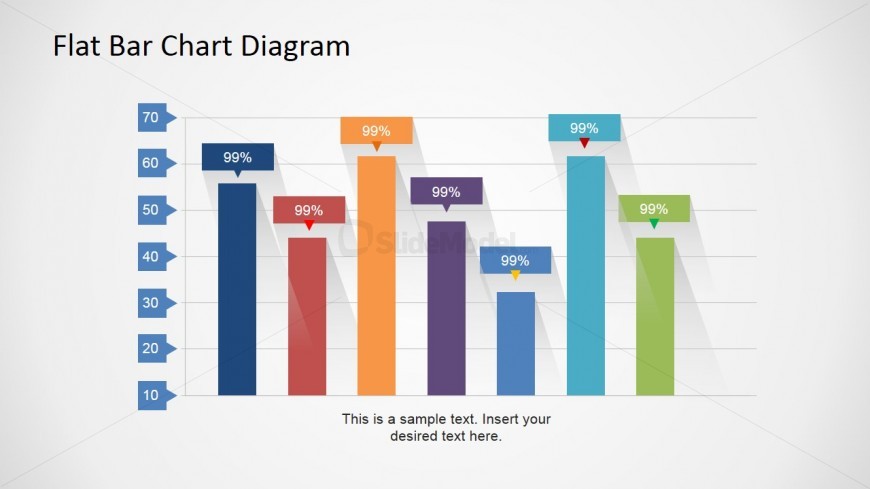
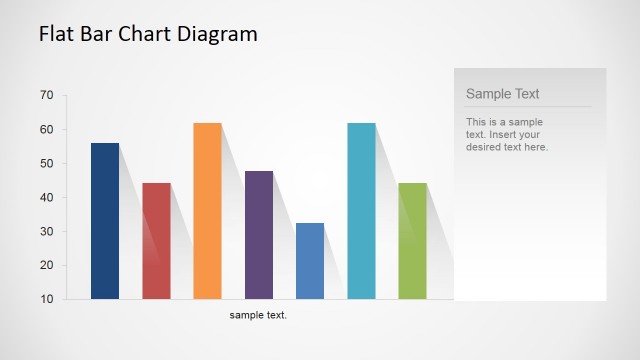
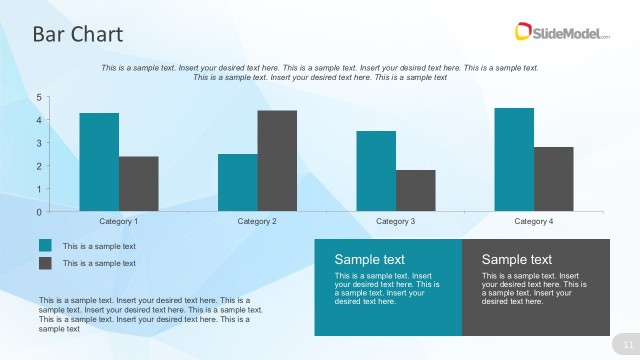
This slide contains a Bar Chart Flat Design for PowerPoint, created with PowerPoint shapes. It contains seven bars colored blue, red, orange, and green. Each bar can be customized in all its properties. The markers can be edited in appearance and text. They are located on top of each bar. A text placeholder can be found below the bar chart. The presenter can use it to insert summaries and relevant information so that the slide is more understandable.
The bar chart can be used to compare a set of statistical information among different areas or departments. This can be utilized in progress reports to show sales trends across several time periods. The presenter can even include percentages, to show information such as growth rate.
Return to Flat Bar Chart Diagram for PowerPoint.
Download unlimited PowerPoint templates, charts and graphics for your presentations with our annual plan.
DOWNLOADReturn to Flat Bar Chart Diagram for PowerPoint.
