Financial Savings PowerPoint Dashboard
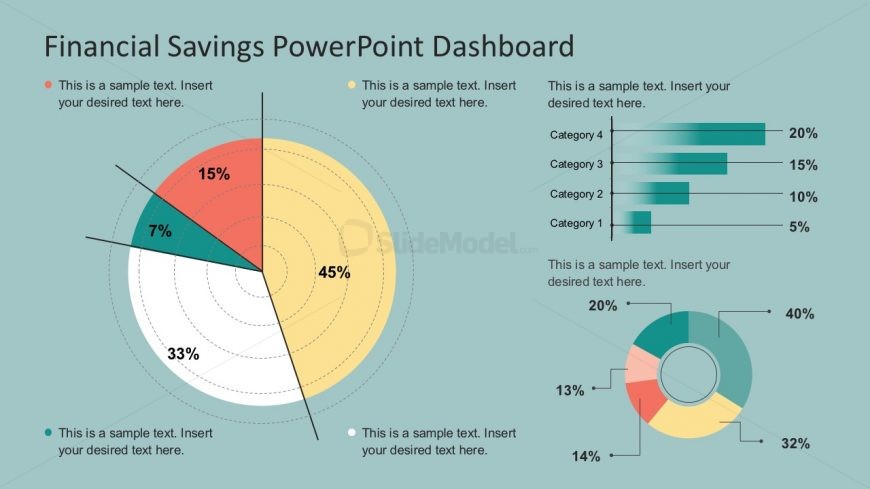
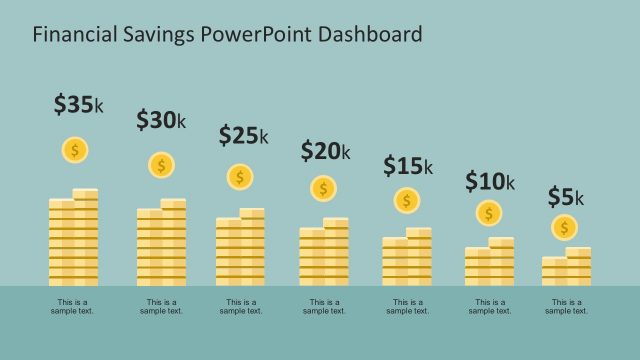
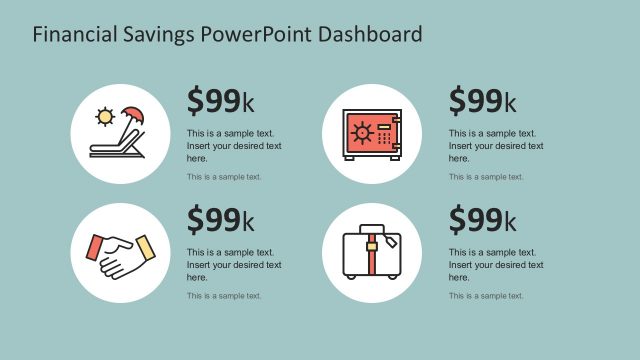
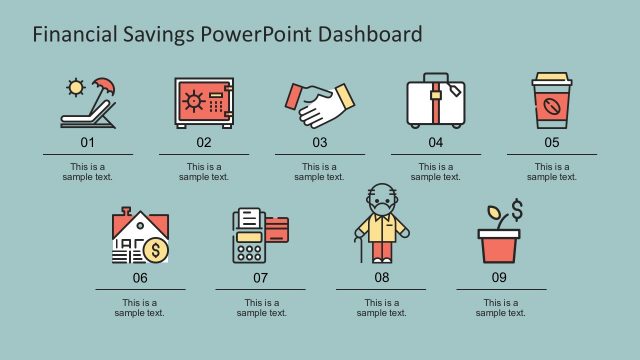
This is a PowerPoint dashboard for financial savings and budgeting. The theme of slide is matte autumn with interesting choice of color scheme enhancing a visual impact of presentation. The management dashboard template contains three data driven PowerPoint Chats. A pie chart has 6 dotted circle frames with four sections dividing it in percentage. The four text placeholders represented with colored bullet point symbol to add details of every items in pie. A horizontal graph has green gradient shaded bars and the doughnut shaped chart with 5 segments of attractive colors has an impressive line style use in flow charts.
Return to Financial Savings PowerPoint Infographics.