Financial Infographic Dashboard Presentation
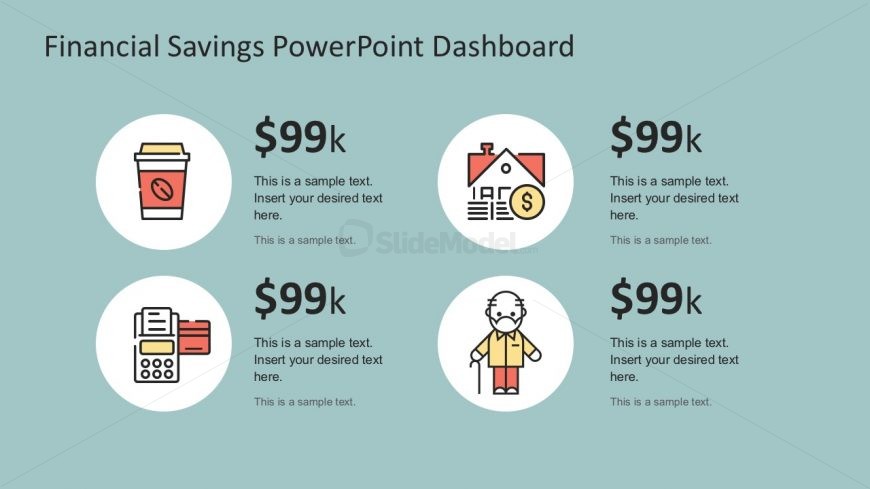
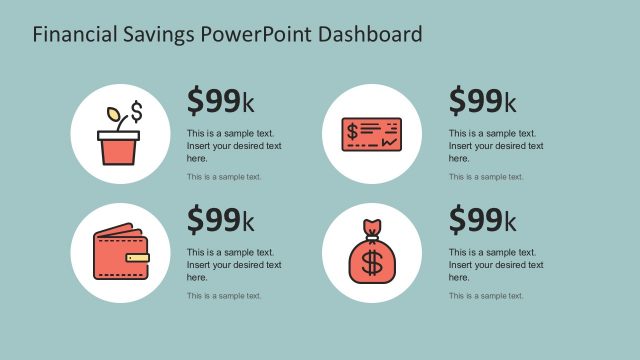
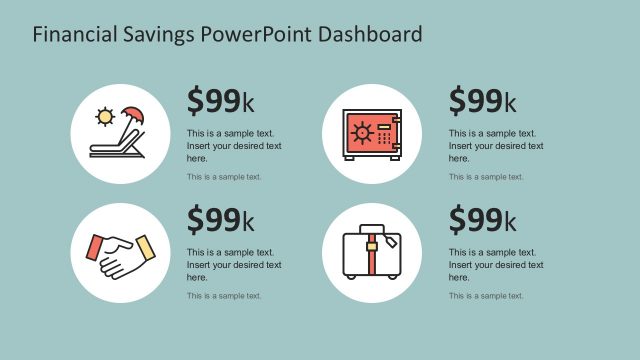
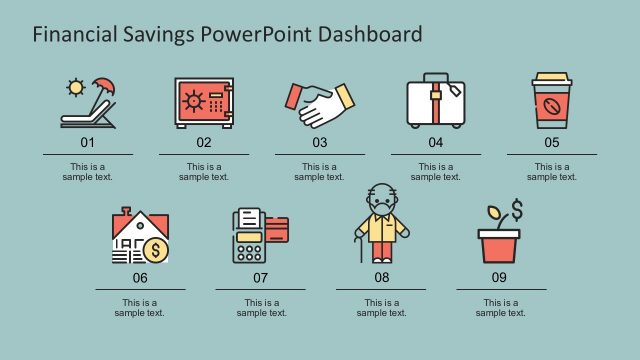
This financial infographic slide contains four icons representing how average man spends or save his earnings. The coffee cup gives an idea of spending money on items of daily use. The house shape with dollar currency symbol indicates investment on property. The image of old man can represent paying for senior’s benefit insurance. The text placeholders on the right side of each icon can be used to add details of how much average human spends yearly or monthly on these items. The editable PowerPoint shapes and text fields are organized in an easy, understandable order.
Alternatively, you can download a free finance dashboard template for PowerPoint & Google Slides presentation, or other finance presentation slides for PowerPoint.
Return to Financial Savings PowerPoint Infographics.