Slide 3 of 11 from Financial Report PowerPoint Template
Revenue Breakdown Slide for PowerPoint with Donut Chart
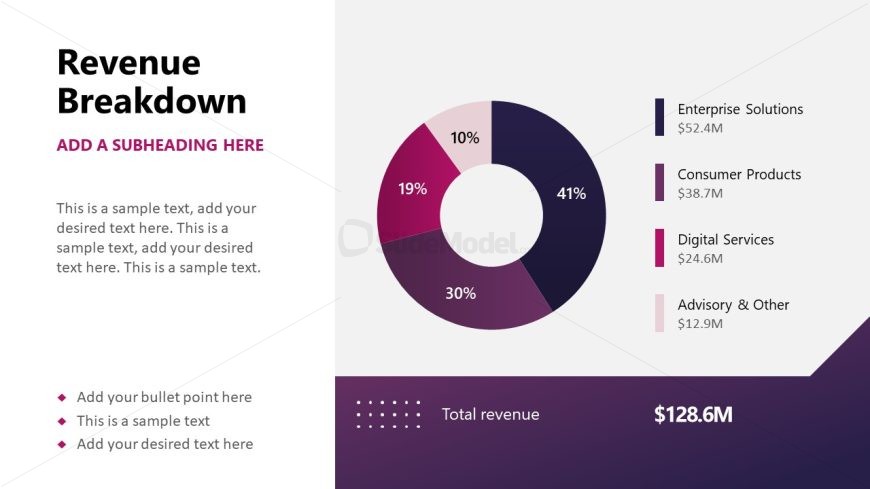
Revenue Breakdown Chart for Financial Report
- Chart
- Pie Chart
- Financial Summary Slide
- 16:9
- 100% Editable
The Revenue Breakdown Chart slide from the Financial Report PowerPoint Template offers a clear visualization of financial data using a pie chart with editable shapes and vector icons. This slide layout supports business presentations by effectively illustrating revenue distribution, making it suitable for budget reviews and financial analysis within a corporate presentation or pitch deck template.
What’s on This Slide
The layout features a pie chart on the right side, displaying segments labeled with percentages and corresponding revenue figures. The chart includes four segments, each varying in size and color, with the largest segment at 41%. To the left, there are text placeholders for the title, subtitle, and body text, aligned vertically. Below the chart, a total revenue figure is prominently displayed. The background is a light color, while the pie chart uses a gradient color scheme. The overall composition balances visual data representation with textual information.
How to Use It
This layout serves as a revenue breakdown visualization, ideal for showcasing financial data in a presentation. It fits well after introductory slides that establish context, providing a clear view of revenue sources. This structure is useful in business scenarios like financial reviews, budget presentations, and performance evaluations, where stakeholders need to understand revenue distribution. It can also be adapted for reports on sales performance or product line profitability, making it versatile for various financial discussions.
Text Placeholders & Capacity
Keep your copy within these limits so it fits without resizing. Body slots can hold roughly 15-20 words each.
| Placeholder | Count | Max characters (approx.) |
|---|---|---|
| Slide title | 1 | 30 |
| Subtitle | 1 | 40 |
| Body paragraph | 3 | 100 |
| Item heading | 4 | 20 |
| Item body | 4 | 20 |
| Kpi value | 1 | 10 |
Slide Keywords
Download unlimited PowerPoint templates, charts and graphics for your presentations with our annual plan.
DOWNLOADReturn to Financial Report PowerPoint Template.