Slide 9 of 14 from Business Development PowerPoint Template
Revenue Mix and Business Model Strategy Slide with Chart
Revenue Mix and Business Model Overview
- Chart
- Pie Chart
- Financial Summary Slide
- 16:9
- 100% Editable
The Revenue Mix and Business Model slide from the Business Development PowerPoint Template offers a clear visual of revenue streams using a pie chart alongside explanatory text, ideal for corporate presentations focused on financial overview and revenue strategy. This slide layout supports business presentations by combining editable shapes and vector icons to enhance clarity in discussing diverse revenue sources within a slide deck.
What’s on This Slide
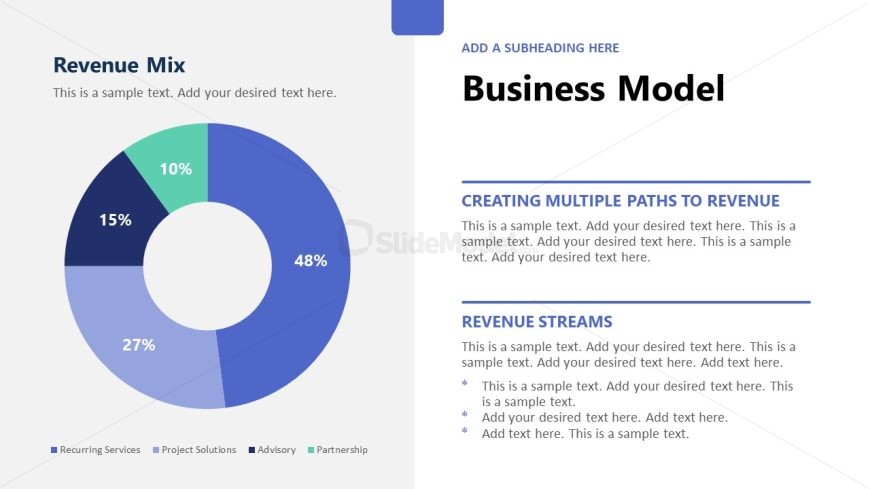
The slide features a pie chart on the left side, displaying a revenue mix with four segments: Recurring Services, Project Solutions, Advisory, and Partnership. Each segment is color-coded and labeled with percentage values: 10%, 15%, 27%, and 48%. To the right, there are two text sections labeled 'Creating Multiple Paths to Revenue' and 'Revenue Streams,' each containing sample text placeholders. The overall layout is divided vertically, with the chart occupying the left half and the text sections on the right, creating a balanced visual hierarchy.
How to Use It
This layout serves to present a revenue model, illustrating the distribution of different revenue streams alongside descriptive text. It is suitable for business presentations that aim to explain financial strategies or models. The slide fits well after a problem statement and before discussing solutions, making it effective for outlining business strategies in a growth context. It can be used in discussions about revenue diversification or financial planning.
Text Placeholders & Capacity
Keep your copy within these limits so it fits without resizing. Body slots can accommodate roughly 15-20 words each.
| Placeholder | Count | Max characters (approx.) |
|---|---|---|
| Slide title | 1 | 30 |
| Subtitle | 1 | 40 |
| Body paragraph | 4 | 100 |
| Item heading | 4 | 10 |
| Item body | 4 | 10 |
Slide Keywords
Download unlimited PowerPoint templates, charts and graphics for your presentations with our annual plan.
DOWNLOADReturn to Business Development PowerPoint Template.