Slide 1 of 5 from Financial Projections & Key Metrics Template for PowerPoint
Financial Projection PowerPoint Template
5 Year Financial Projection Table for Key Metrics
- Table
- Data Table
- Financial Summary Slide
- 16:9
- 100% Editable
The 5 Year Financial Projection Table slide from the Financial Projections & Key Metrics Template for PowerPoint offers a clear layout for presenting essential financial data over multiple years. This slide template is designed to support budget presentations and cash flow analysis by organizing key metrics like revenue and expenses in an easy-to-read table format. It is a practical choice for business presentations requiring detailed financial summaries using editable slides and vector icons.
About This Slide
Financial Projection slide design for PowerPoint presentations with table style.
What’s on This Slide
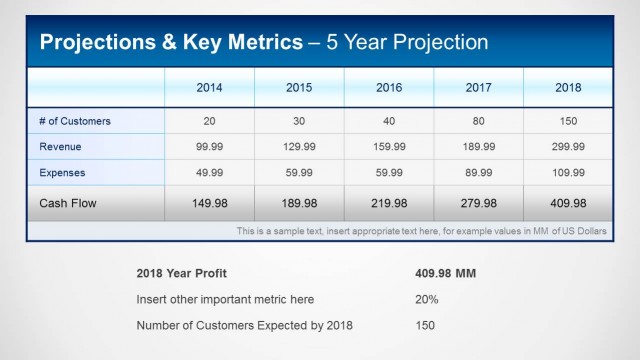
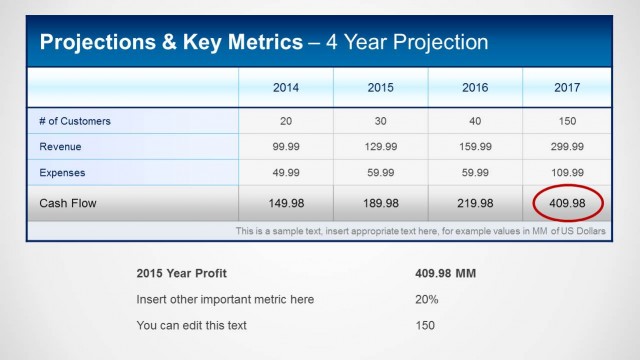
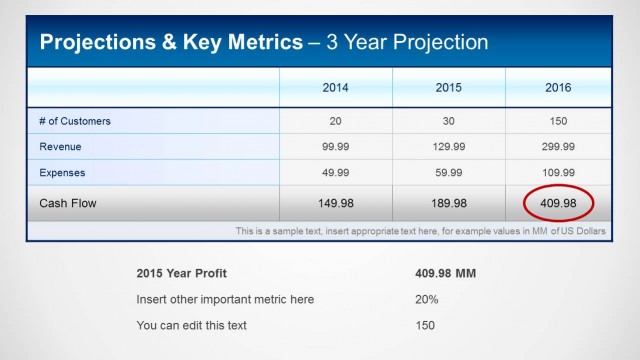
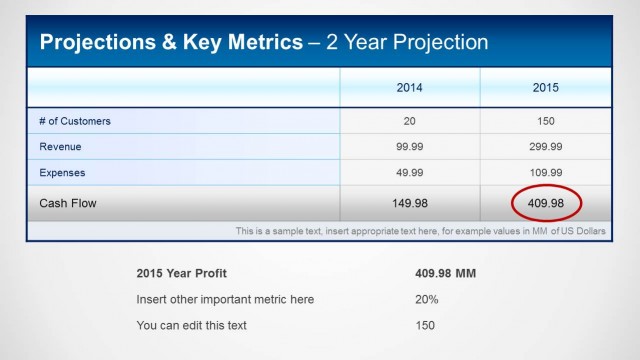
The layout features a table positioned centrally, displaying financial metrics across five years from 2014 to 2018. The table has a header row with five columns, each representing a year. The first column lists key metrics: # of Customers, Revenue, Expenses, and Cash Flow. Each metric has corresponding values for each year, organized in rows. Below the table, there are two text placeholders for additional metrics, aligned left. The overall color scheme includes a blue header and a light background, ensuring clarity and visual separation of data.
How to Use It
This layout serves as a financial projection table, ideal for presenting key metrics over a five-year period. It fits well at the beginning of a financial report, providing a clear overview of anticipated revenue, expenses, and customer growth. Suitable for finance teams, executives, and stakeholders, this structure can be used to summarize financial expectations and facilitate discussions on budget planning and cash flow management. It is effective for conveying essential financial data in a concise manner.
Text Placeholders & Capacity
Keep your copy within these limits so it fits without resizing. Body slots can accommodate roughly 5-8 words each.
| Placeholder | Count | Max characters (approx.) |
|---|---|---|
| Slide title | 1 | 30 |
| Body paragraph | 2 | 50 |
| Item heading | 4 | 20 |
| Item body | 20 | 10 |
Slide Keywords
Download unlimited PowerPoint templates, charts and graphics for your presentations with our annual plan.
DOWNLOADReturn to Financial Projections & Key Metrics Template for PowerPoint.