Exponential Growth PowerPoint Template
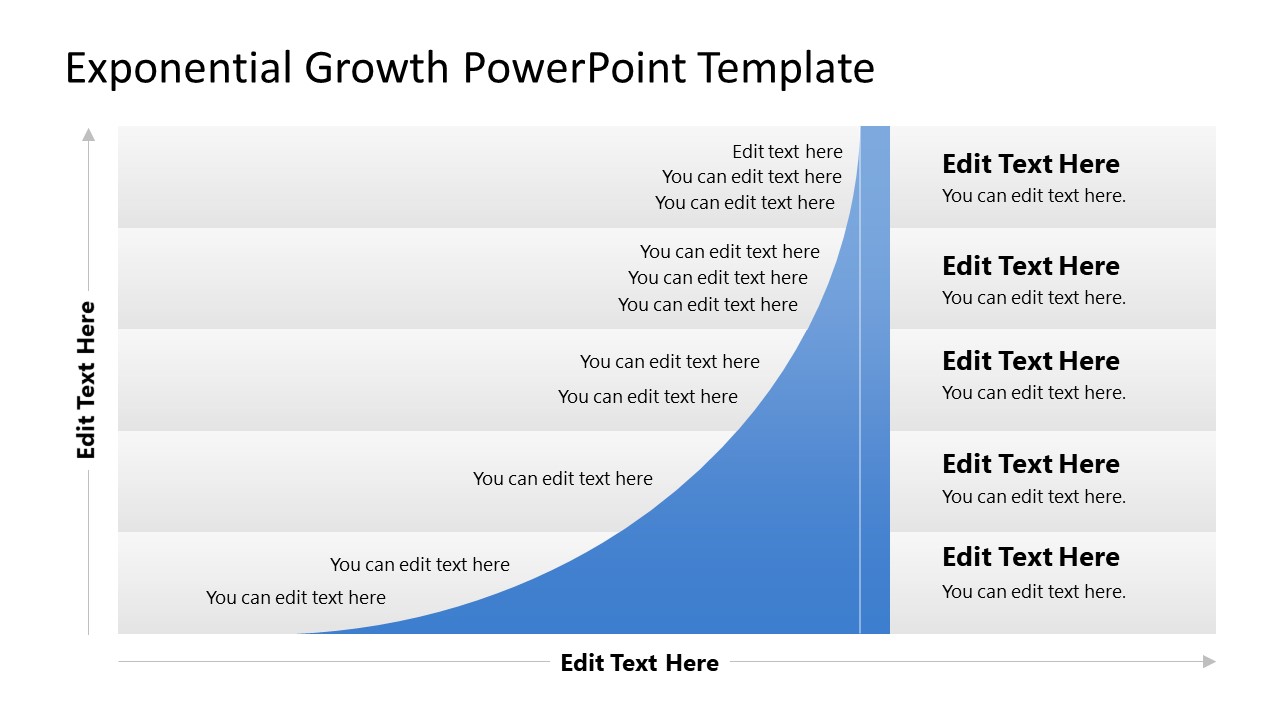
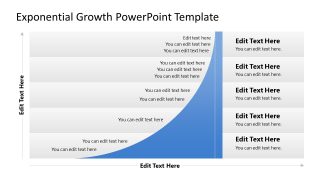
Present the business growth concept using our editable Exponential Growth PowerPoint Template. The exponential growth curve helps illustrate the principle that consistent, small efforts compound over time to produce a larger outcome. This can be applied to marketing, sales, automation, or efforts related to business growth, development, and digitalization. This template features a two-axis chart, created with PowerPoint elements, allowing users to customize the design to match their theme perfectly. They can change the colors, graph type, text fonts, and other PPT items based on their data. We have developed this template using customizable elements, which you can also edit with Google Slides and Keynote. On the axes of the exponential growth concept chart, you can display the following points:
- X-Axis: Time, Effort, Input
- Y-Axis: Results, Output, Performance
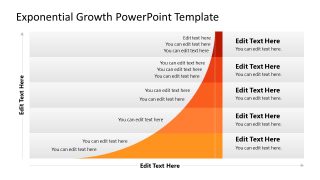
The upward slope of the graph indicates that growth is initially slow, but after some time, the graph rapidly moves upward with a sharp rise, implying exponential growth. Users have the option to modify the labels according to their research data. The Exponential Growth PowerPoint Template features two slides with the same chart; however, the first slide displays a blue graph, while the second slide features an orange graph. The overall graph can be divided into five segments, which correspond to the primary stages of the developmental process. On the inward side, you can further display the activities to be performed in the particular business milestones. Marketers can use this chart template to illustrate the cumulative impact of digital marketing over a specified period. Download this exponential growth template to use in your technology innovation, marketing, sales, or educational learning presentations!

You must be logged in to download this file.
DOWNLOAD- Category
- Data & Charts
- Rating

 Loading...
- Size
- 16x9
- Item ID
- 22883-02
- Colors
Subscribe today and get immediate
access to download our PowerPoint templates.