Slide 11 of 18 from Evidence-Based Insights PowerPoint Template
Trend Analysis Research Data Visualization Slide
Trend Analysis Slide for Presentations
- Chart
- Line Chart
- Evaluation Slide
- 16:9
- 100% Editable
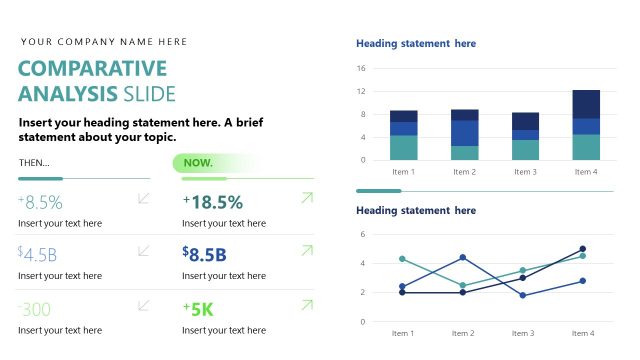
The Trend Analysis Slide from the Evidence-Based Insights PowerPoint Template offers a clear layout for presenting data trends and performance analysis. This slide template includes editable shapes and vector icons to highlight financial forecasting and comparative metrics effectively in a corporate presentation or pitch deck template.
What’s on This Slide
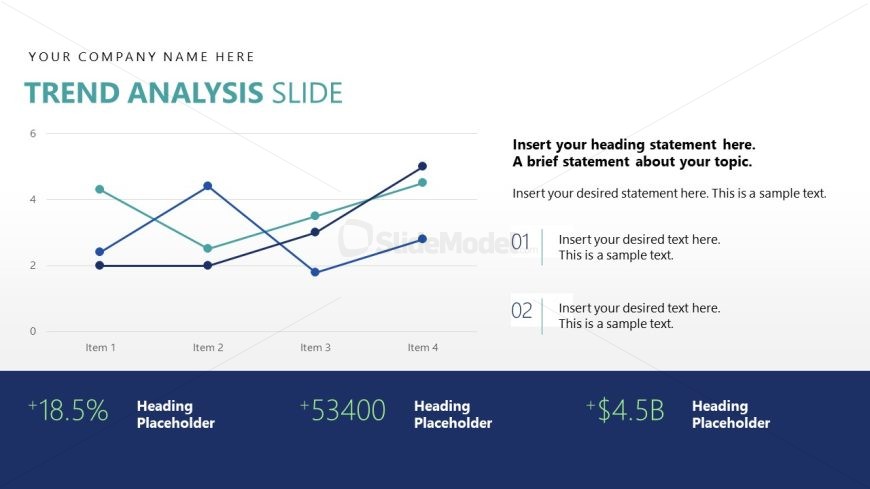
The layout features a line chart positioned centrally, displaying data trends across four items. Above the chart, there are text placeholders for a main heading and a brief statement, both aligned to the left. Below the chart, three additional placeholders are arranged horizontally, each containing numerical data with corresponding headings. The chart has two lines in different colors, indicating distinct data sets. The background is a gradient from light to dark, enhancing visual focus on the chart and text elements. The overall composition is balanced, with clear visual hierarchy.
How to Use It
This layout serves as a trend analysis tool, ideal for presenting data comparisons over time. It fits well in a presentation sequence after problem identification and before strategic recommendations. Suitable for business contexts such as performance reviews, market analysis, or financial forecasting, it allows for clear communication of trends and insights. This slide can be used to illustrate growth, changes, or comparisons among various metrics, making it a versatile choice for data-driven discussions.
Text Placeholders & Capacity
Keep your copy within these limits so it fits without resizing. Body slots can hold roughly 10-15 words each.
| Placeholder | Count | Max characters (approx.) |
|---|---|---|
| Slide title | 1 | 30 |
| Body paragraph | 3 | 50 |
| Item heading | 4 | 10 |
| Data label | 4 | 10 |
Slide Keywords
Download unlimited PowerPoint templates, charts and graphics for your presentations with our annual plan.
DOWNLOADReturn to Evidence-Based Insights PowerPoint Template.