Slide 10 of 18 from Evidence-Based Insights PowerPoint Template
Comparative Analysis with Research Data Charts Slide
Comparative Analysis Slide for Insights Presentation
- Chart
- Combo Chart
- Evaluation Slide
- 16:9
- 100% Editable
The Comparative Analysis Slide from the Evidence-Based Insights PowerPoint Template offers a structured layout ideal for business presentations requiring detailed performance comparison and trend analysis. This slide combines editable shapes and vector icons with a dual-chart design to visually contrast data points, supporting clear market evaluation within a corporate presentation or pitch deck template.
What’s on This Slide
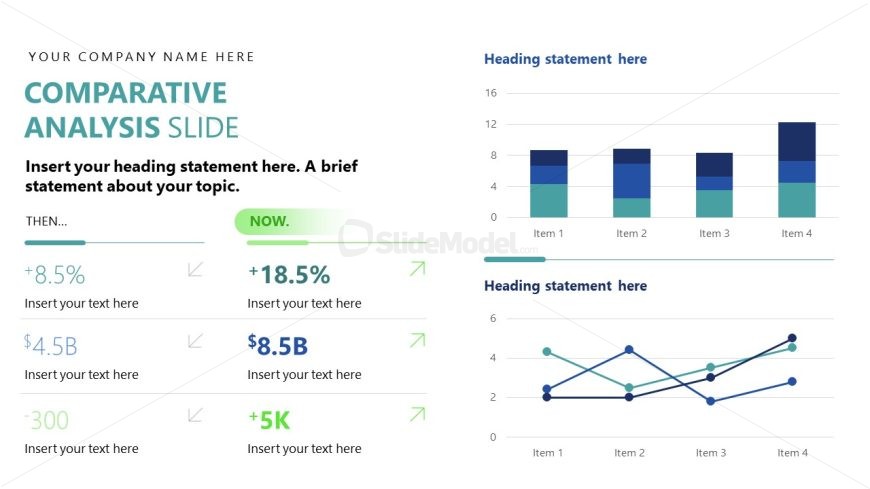
The layout features a left section with two vertical columns and a right section with a chart. The left side contains three rows of text placeholders, each with an upward or downward arrow indicating change. The top row has a larger heading statement placeholder, followed by two smaller text placeholders for values. The right side displays a bar chart and a line chart, both with labeled axes and a title placeholder at the top. The overall color scheme includes shades of blue and green, creating a clear visual hierarchy.
How to Use It
This layout serves as a comparative analysis tool, effectively presenting data before and after a specific change. It fits well in a presentation sequence following a problem slide, allowing for a clear transition to results. This structure is suitable for business scenarios such as performance reviews, market comparisons, or trend analyses, where contrasting data points are essential for decision-making.
Text Placeholders & Capacity
Keep your copy within these limits so it fits without resizing. Text slots are moderate, roughly 3-5 words each.
| Placeholder | Count | Max characters (approx.) |
|---|---|---|
| Slide title | 1 | 30 |
| Item body | 6 | 20 |
| Chart title | 1 | 30 |
| Axis label | 2 | 15 |
Slide Keywords
Download unlimited PowerPoint templates, charts and graphics for your presentations with our annual plan.
DOWNLOADReturn to Evidence-Based Insights PowerPoint Template.