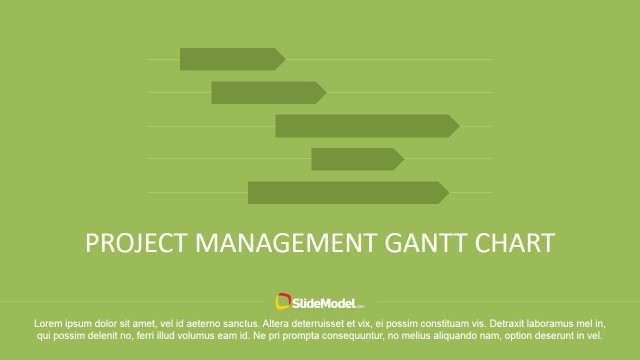
Earned Value Management Chart Template for PowerPoint
Earned Value Management or EVM is a project management methodology. It integrates three key components of a project, i.e., time, cost, and scope to measure performance. This methodology helps predict the future based on planned and actual value. Project managers use such predictions to adjust their plans accordingly. The EVM enables a project team to view work progress against baseline plan, time, cost, and other resources. EMV operates on the principle that the value of work is equal to the number of funds budgeted. There are three variable values to consider in Earned Value Management, i.e., Planned Value, Earned Value, and Actual cost.
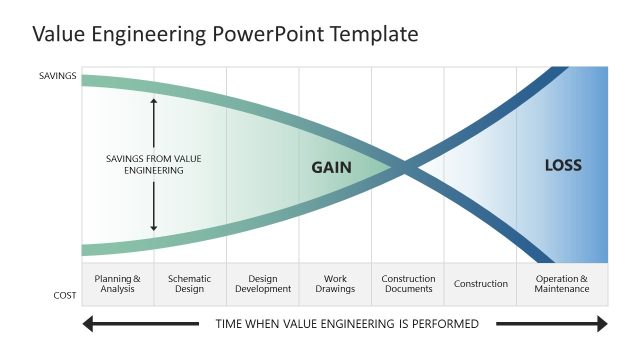
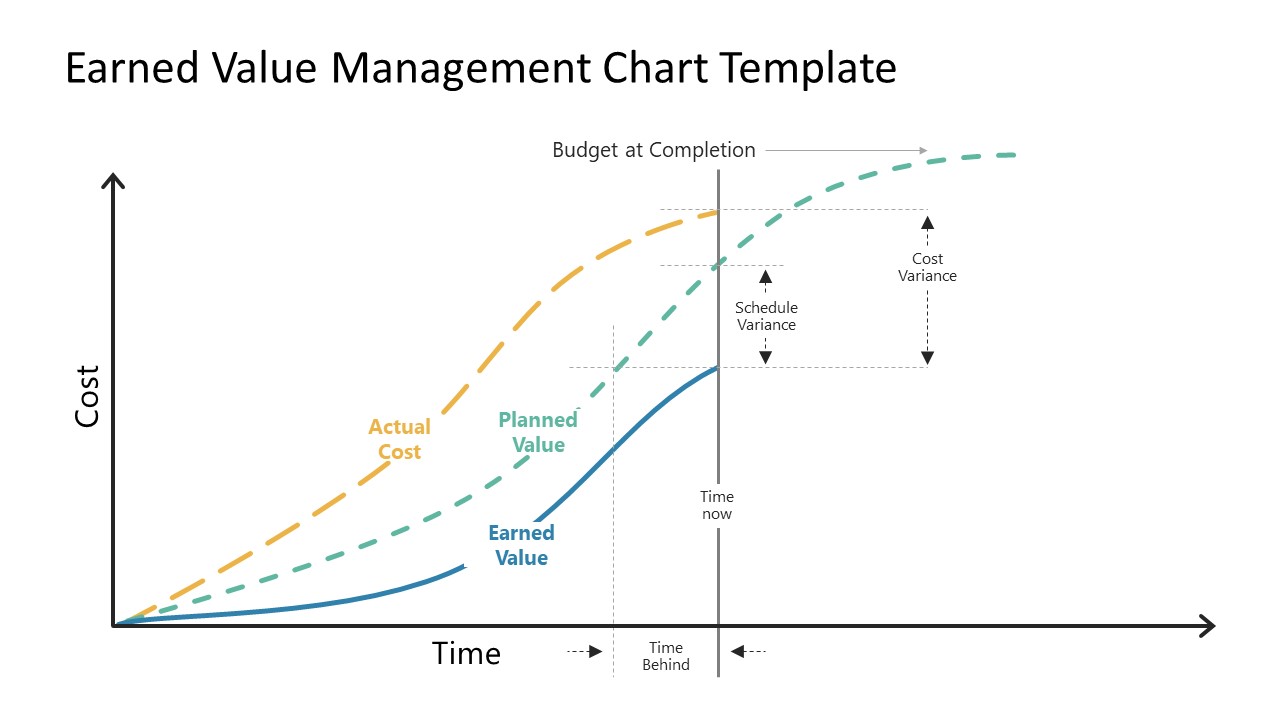
The Earned Value Management Chart Template for PowerPoint is an S-curve graph presentation. It shows three S-curved, one for planned value, earned value, and actual cost. The x-axis of the graph represents time and the y-axis for cost. The project managers use a graph template of earned value management for financial and budgeting meetings. It helps viewers visualize a project’s performance in terms of time and cost. This Earned Value Management chart template contains two slides in white and black backgrounds. Users can choose a layout that matches their project presentation theme. The EVM template also provides pre-defined parameters to measure values. These are time behind, time now, schedule variance, and cost variance. Alternatively, you can download other editable PowerPoint charts and templates for presentations, compatible with PowerPoint and Google Slides.
The Earned Value Management Chart Template for PowerPoint provides editable slides. Users can customize the trend of S-Curved according to their project values. To change the directions, select a curve, go to the Format menu bar, and choose edit point from the edit shapes dropdown menu. Once points are set in the line, drag and drop the points to get the desired curve.
The Earned Value Management PowerPoint is an ideal graph chart for project forecasting presentations. Entrepreneurs and startup businesses also use the EVM template to showcase profitability analysis to the stakeholders.

You must be logged in to download this file.
DOWNLOAD- Category
- Rating

 Loading...
- Size
- 16x9
- Item ID
- 21240-01
- Colors
Subscribe today and get immediate
access to download our PowerPoint templates.