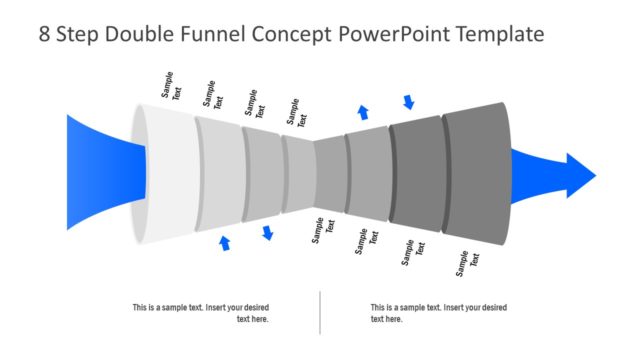
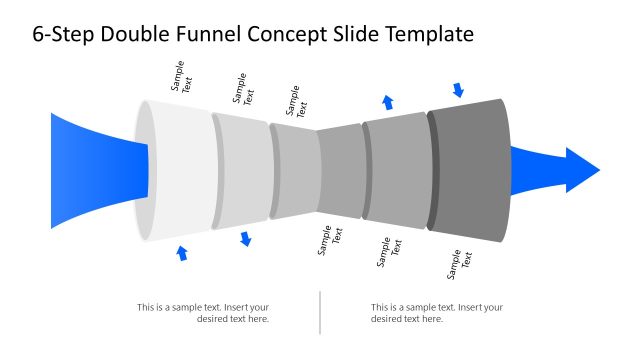
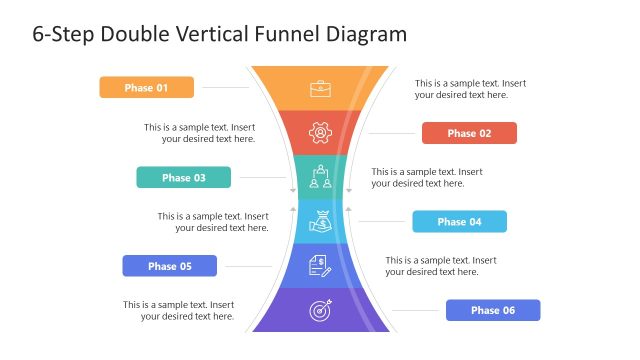
Double Funnel PowerPoint Diagram
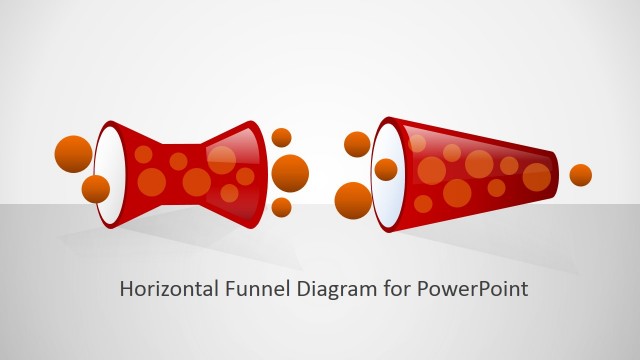
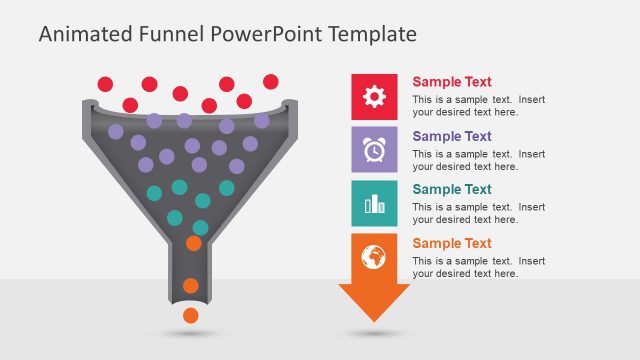
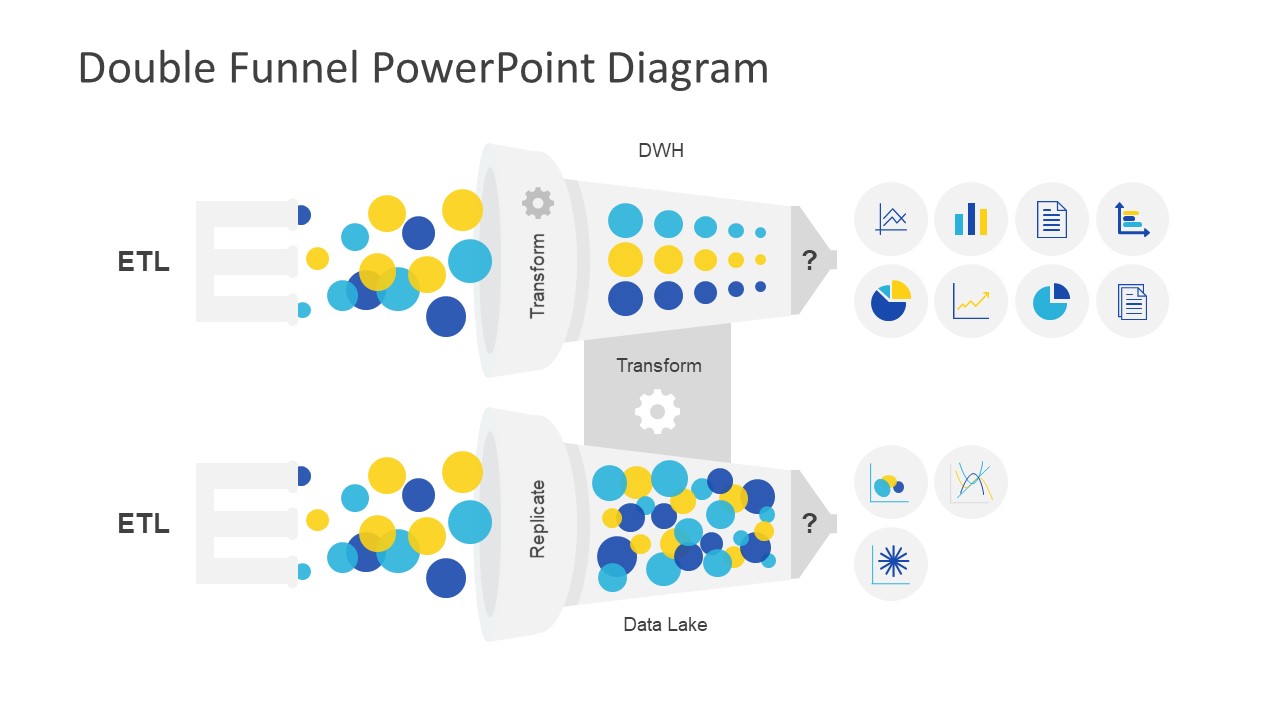
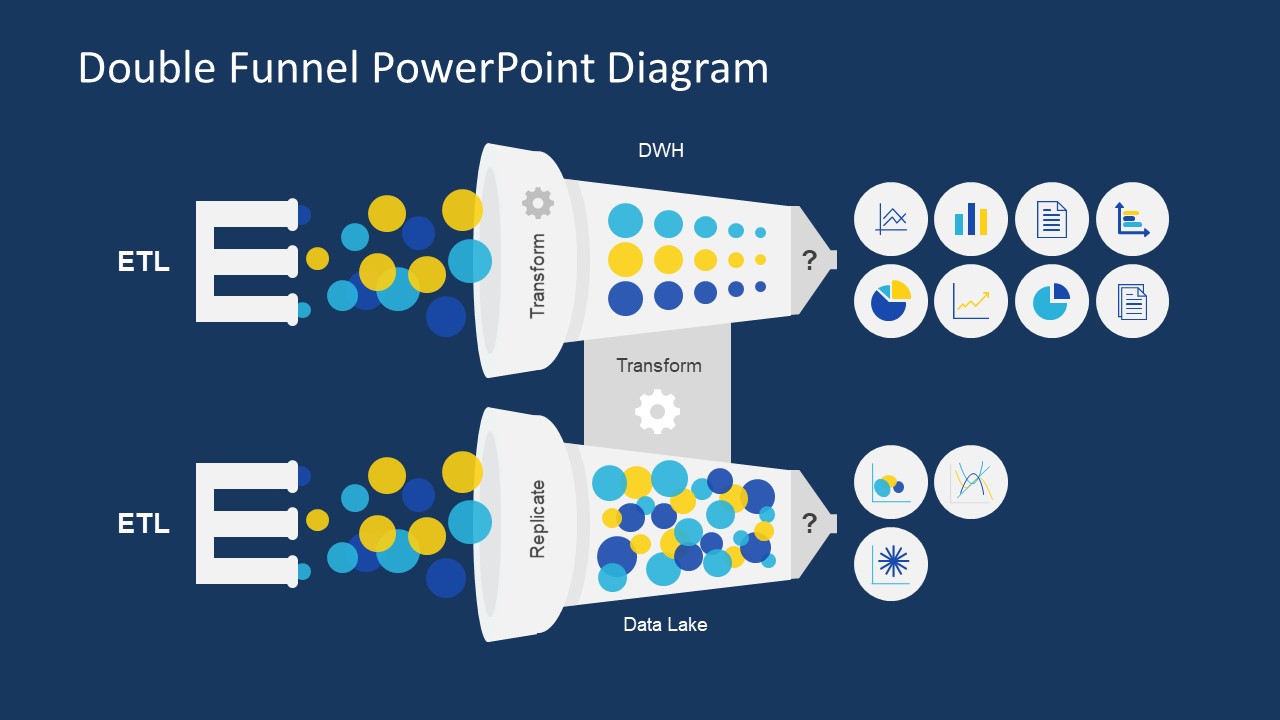
The Double Funnel PowerPoint Diagram provides an interactive visualization of horizontal process flow. The two diagrams of funnel shape here present two different concepts and their purpose together. For example, the transformation arranges data into a set of understandable information. Therefore, the circular infographic icons as the result of transformation show various data charts and reports. It illustrates the conversion of scattered data into graphically presentable statistics. Similarly, the funnel of replicating data shows the clusters of circles inside. These circular PowerPoint shapes represent data in the double funnel diagram of PowerPoint. Whereas, the output of this process shows infographic chart icons without numerical evaluation. The four-slide PowerPoint has a vector design diagram and illustrations of the technical project team.
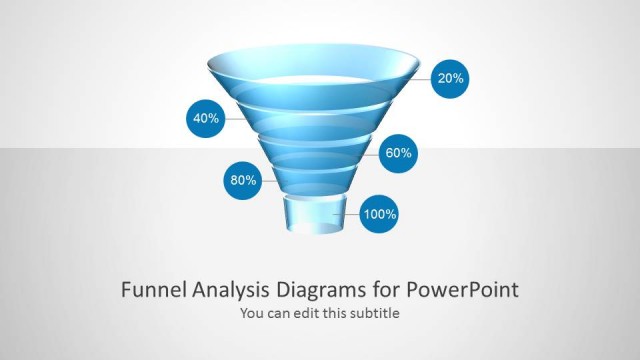
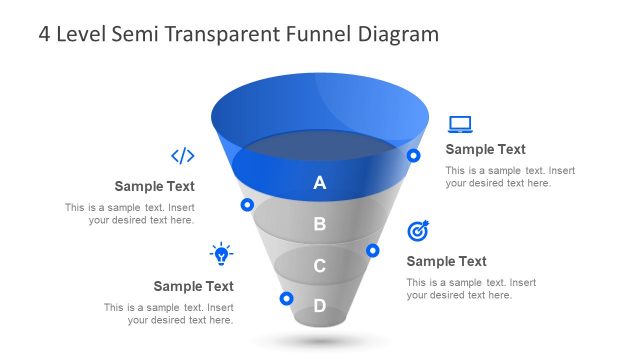
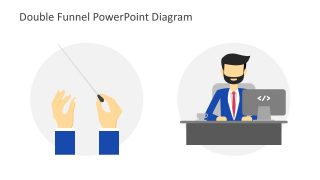
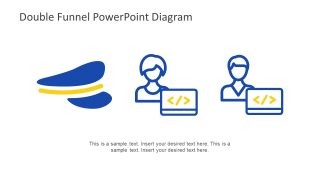
The Double Funnel PowerPoint Diagram has two slides displaying the diagram with assorting backgrounds. Hence, it suggests the idea of customizing a background for the presentation. Also, the dark background slide is usable in presentation with the dark theme with minimum modifications. The funnel diagrams are suitable for presenting sales, the progress of advertising campaigns, the bottleneck in linear processes, etc. The double funnel PowerPoint is ideal for describing process flow, selection criteria, filtering leads, and a sales funnel process. Further, the slides displaying an illustration of the user working on the computer have the coding icon. Also, the user infographic displays the development process for an application or system. The double funnel template can also describe a Cost-Benefit Analysis between two different alternatives or make a side-by-side comparison between two possible sales funnel strategies.
The double funnel PowerPoint template diagram has text placeholders to insert keywords and necessary descriptions. Although it is a helpful funnel diagram for sales analysis presentations, it also highlights the factors of the process for the audience. The SlideModel provides a fantastic collection of funnel PowerPoint diagrams for its users. These slides inspire the audience with the help of high-quality graphics and remain longer in memory. Moreover, the innovative funnel of colorful spheres helps clarify the concepts while presenting.


You must be logged in to download this file.
DOWNLOAD- Category
- Diagrams
- Rating

 Loading...
- Size
- 16x9
- Item ID
- 7677-01
- Colors
Subscribe today and get immediate
access to download our PowerPoint templates.