Slide 9 of 13 from Digital Transformation Business Process Management PowerPoint Template
KPIs Slide – Digital Transformation PPT Template
Key Metrics and KPIs Slide
- Chart
- Combo Chart
- Evaluation Slide
- 16:9
- 100% Editable
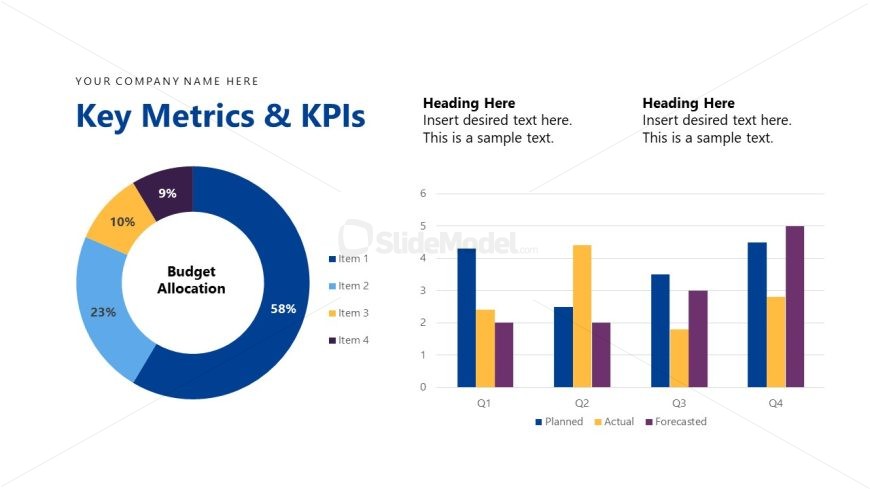
The Key Metrics and KPIs slide from the Digital Transformation Business Process Management PowerPoint Template offers a structured layout combining circular and bar charts to visualize budget allocation and quarterly performance data. This slide template is designed for business presentations focused on quarterly reviews and performance evaluations, featuring editable shapes and vector icons that enhance clarity and engagement in corporate presentations and pitch deck templates.
What’s on This Slide
The layout features a left circular chart and a right vertical bar chart. The circular chart displays budget allocation with segments labeled 9%, 10%, 23%, and 58%. The bar chart has four bars for each quarter labeled Q1 to Q4, with three distinct colors representing planned, actual, and forecasted values. Text placeholders are present at the top for the company name and slide title, and additional placeholders exist for headings and sample text beneath the charts. The overall composition balances visual elements on either side, creating a structured layout.
How to Use It
This layout serves to present key metrics and KPIs in a business context, ideal for performance reviews or strategic planning sessions. It fits well after problem identification slides, providing a clear view of budget allocation and performance metrics. This format is useful for stakeholders to assess progress against goals and make informed decisions based on visual data representation. It is suitable for quarterly business reviews or project updates.
Text Placeholders & Capacity
Keep your copy within these limits so it fits without resizing. Body slots can accommodate roughly 15-20 words each.
| Placeholder | Count | Max characters (approx.) |
|---|---|---|
| Slide title | 1 | 30 |
| Item heading | 4 | 10 |
| Chart title | 1 | 30 |
| Body paragraph | 2 | 100 |
Slide Keywords
Download unlimited PowerPoint templates, charts and graphics for your presentations with our annual plan.
DOWNLOADReturn to Digital Transformation Business Process Management PowerPoint Template.