DIBB Model PowerPoint Template
Our DIBB Model PowerPoint Template is a one-pager flow diagram representing the 4 stages of the DIBB framework. The data-Insight-Belief-Bet (DIBB) model helps companies align their various functional units for a central cause according to their strategic goals. Henrik Kniberg developed this framework to create a system that involves the ability of individuals to raise a query or even falsify existing beliefs through the latest gathered information. By following this approach, companies can look into the feedback and update the bets that improve the overall functioning. This DIBB framework is used by Spotify, where specialists analyze the data and set up their goals (North Star goals) by following this approach.
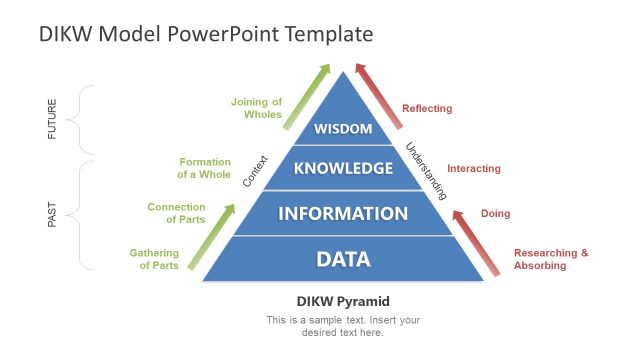
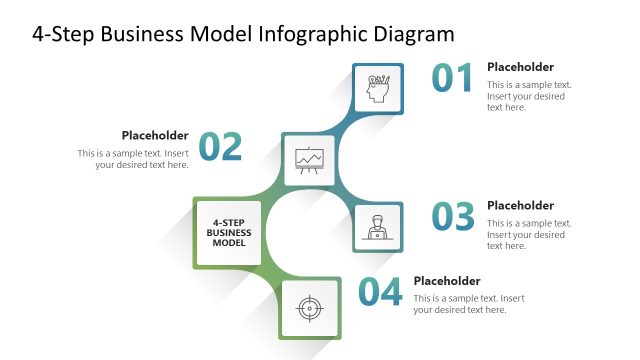
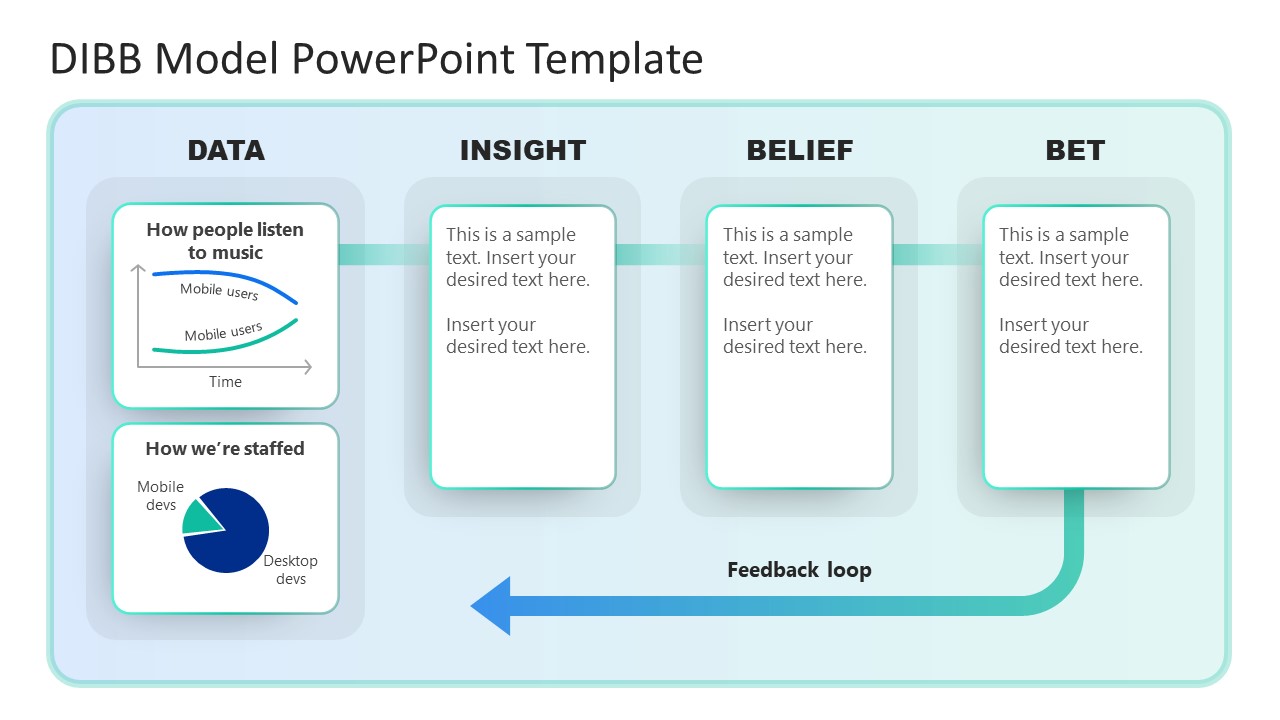
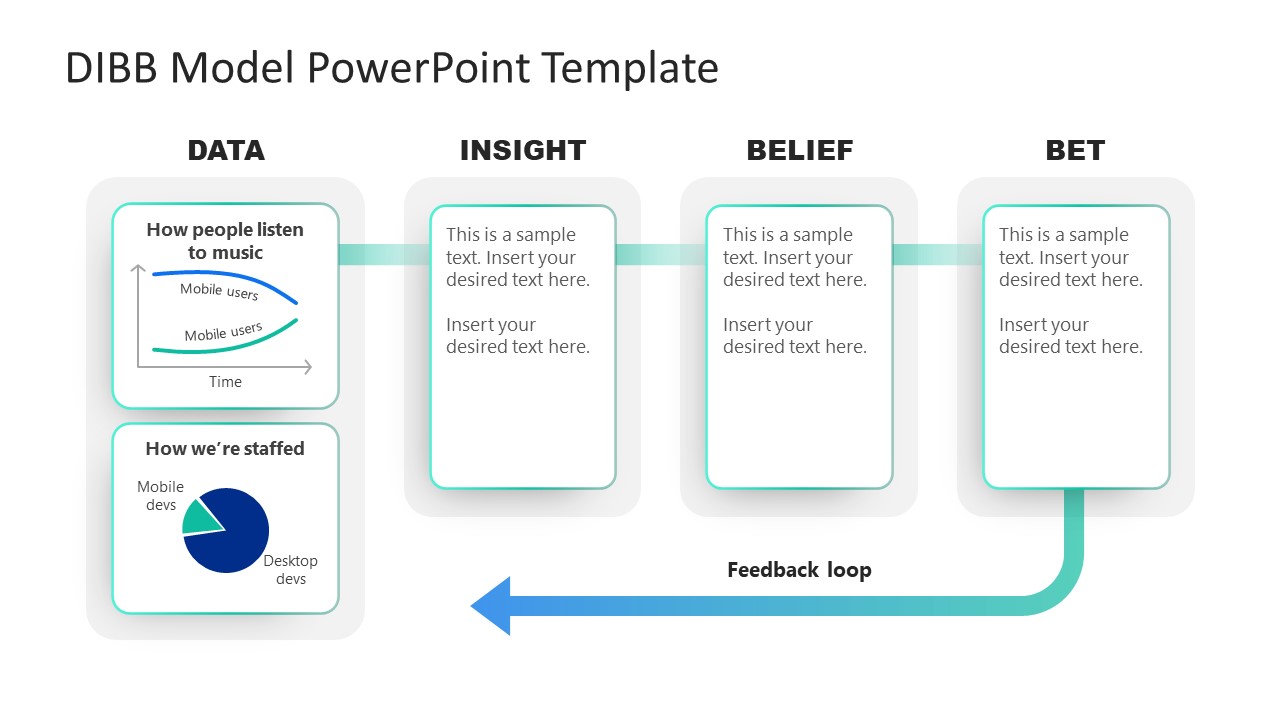
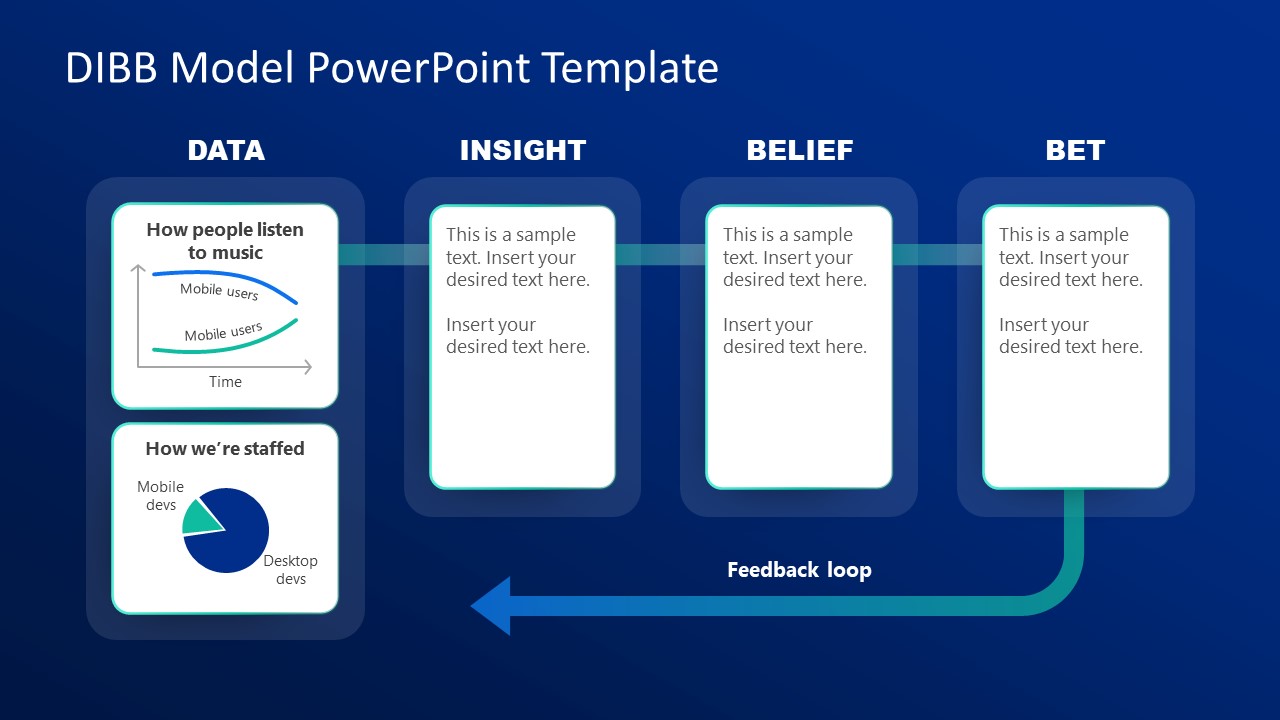
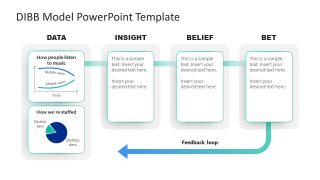
This PowerPoint template comprises four vertical columns diagram, each representing individual stages of the DIBB model. These four diagrams are connected via a straight line that bends at the end, depicting a feedback loop. The design of these PowerPoint shapes is attractive, i.e., thin outline and shadow effect. Presenters can use the description text areas in these boxes to add the relevant details for each segment of the DIBB model, i.e.,
- Data: Start with facts, for instance, market trends, what’s innovative around you, and other relevant details.
- Insight: Analyze the collected data using analysis and reasoning models to devise feasible insights.
- Belief: After the thorough analysis, state your hypothesis. It can either be falsified or proved true by practical implementation and feedback.
- Bet: Take particular action based on the beliefs and define the expected outcomes of your plan.
Based on these bets, the North Start goals are settled. Once these goals are achieved, these testified beliefs turn into company beliefs that the terminal segment of this model. Professionals can arrange these details using this DIBB Model PowerPoint Template and present it before the workforce. Users can use this template to display the bets that are open to debate. Also, this diagram can illustrate the use-cases of this DIBB model for various applications in any training session. The North Star can be the company goal, in a given timeframe, let’s say 2-year goals. While the Bets can include:
- Company bets: large cross-organizational projects (generally these projects are lasting 6 to 12 months)
- Functional bets: including large function-based projects which are aligned to Company Bets.
- Marketing bets: including rapid initiatives and investments made by teams.
This PPT template is entirely editable, using all major versions of PowerPoint and Google Slides. Users can alter the fonts, color scheme, and text arrangement within the segments. So, grab this easy-to-edit template and enhance your professional presentations with this modern schematic diagram.


You must be logged in to download this file.
DOWNLOAD- Category
- Models
- Rating

 Loading...
- Size
- 16x9
- Item ID
- 21487-01
- Colors
Subscribe today and get immediate
access to download our PowerPoint templates.