Slide 4 of 8 from Data Driven Campaign Analysis Infographics
Marketing Campaign Analysis PowerPoint
Data Metrics with Line Chart Infographic
- Diagram
- Other
- Evaluation Slide
- 16:9
- 100% Editable
What’s on This Slide
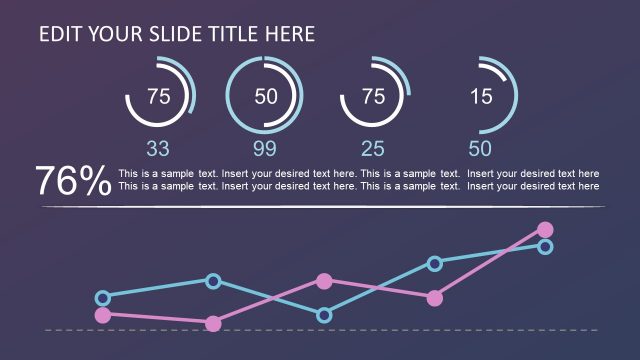
The layout features a title placeholder at the top center, followed by three large numeric placeholders aligned horizontally on the top row. Below these, there are corresponding text placeholders for descriptions. A line chart occupies the right side, displaying a pink line against a grid background. Below the chart, four triangular icons are placed above smaller numeric placeholders, each aligned in a row. A horizontal line connects circular icons at the bottom, with additional text placeholders for descriptions. The background is a gradient from purple to dark purple.
How to Use It
This layout serves as a data metrics overview, ideal for presenting key performance indicators alongside a visual trend analysis. It fits well in a presentation sequence after a problem slide, transitioning to a solution or strategy discussion. This structure is useful in business contexts such as marketing performance reviews, sales data analysis, or campaign effectiveness presentations, allowing for clear communication of numerical data and trends.
Text Placeholders & Capacity
Keep your copy within these limits so it fits without resizing. Text slots are spacious, allowing for detailed descriptions.
| Placeholder | Count | Max characters (approx.) |
|---|---|---|
| Slide title | 1 | 30 |
| Item body | 3 | 50 |
| Item body | 4 | 50 |
| Item body | 1 | 50 |
Slide Keywords
Download unlimited PowerPoint templates, charts and graphics for your presentations with our annual plan.
DOWNLOADReturn to Data Driven Campaign Analysis Infographics.