Slide 3 of 8 from Data Driven Campaign Analysis Infographics
Infographic Presentation of Campaign Analysis
Data Visualization Slide for Campaign Analysis
- Diagram
- Comparison Split
- Analysis Slide
- 16:9
- 100% Editable
What’s on This Slide
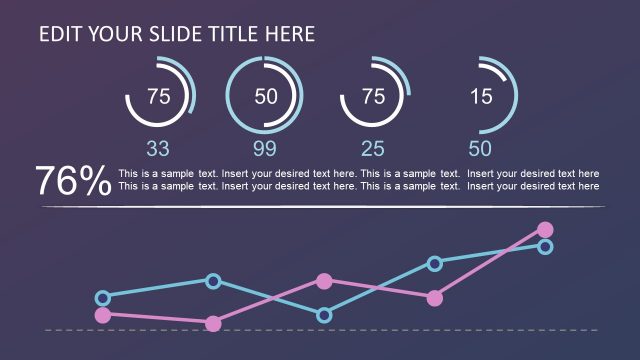
The layout features two main sections. On the left, a circular diagram with concentric rings displays five segments in varying colors, arranged from the center outward. Each ring has a corresponding text placeholder aligned vertically. On the right, a line chart presents data trends with a gray area under the line, and grid lines for reference. Text placeholders are positioned above and below the chart, allowing for descriptive content. The background is a gradient, transitioning from dark purple to lighter shades, enhancing visual contrast.
How to Use It
This layout serves to compare data visually while providing contextual information. It is suitable for presentations that analyze campaign performance or marketing metrics. The circular diagram can represent categories or phases, while the line chart illustrates trends over time. This slide fits well after problem identification slides, leading into detailed analysis or recommendations, making it ideal for business strategy discussions.
Text Placeholders & Capacity
Keep your copy within these limits so it fits without resizing. Body slots can accommodate roughly 10-15 words each.
| Placeholder | Count | Max characters (approx.) |
|---|---|---|
| Slide title | 1 | 30 |
| Item body | 5 | 50 |
| Body paragraph | 2 | 100 |
Slide Keywords
Download unlimited PowerPoint templates, charts and graphics for your presentations with our annual plan.
DOWNLOADReturn to Data Driven Campaign Analysis Infographics.