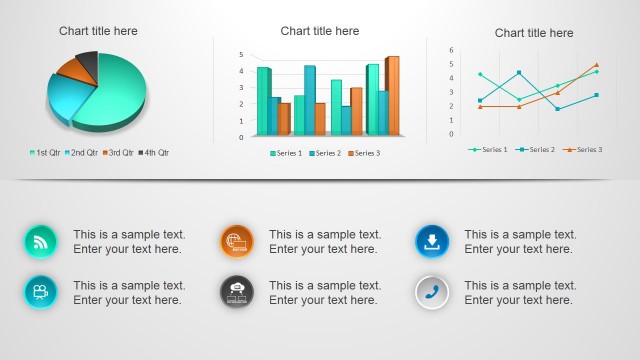
Dashboard PowerPoint Slide with Charts
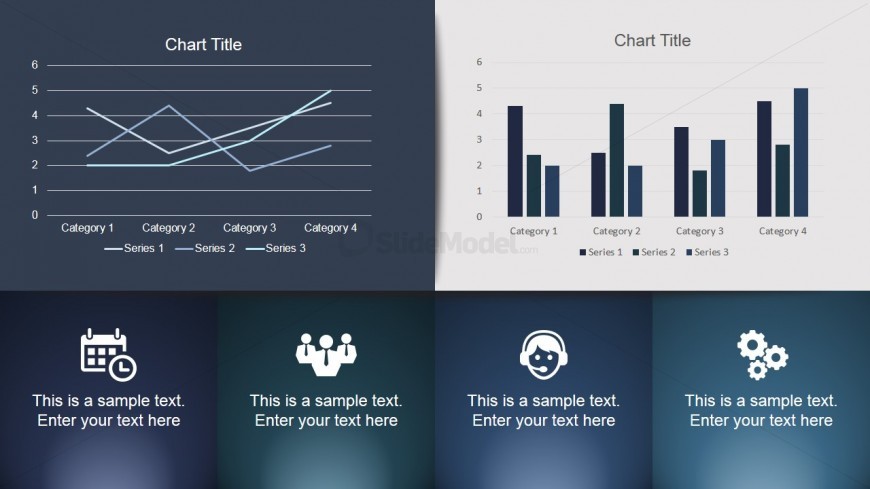
Featured on the Office template is a dashboard PowerPoint with charts, which may be used to present two sets of financial and organizational statistics, such as volumes in sale across a time period, and a comparison of four sets of data. It may also be used to show four elements which relate to or affect these statistical data.
Two graphs are to be found at the top of the PowerPoint slide. These are a line chart, with four periods, and a vertical bar graph with three bars corresponding to each of the four periods. The bottom half of the slide design is divided into four segments. Each segment contains a white generic icon, such as a calendar, a trio of office workers, a call center agent, and a set of gears, and a text placeholder where short descriptive statements may be inserted. All PowerPoint objects are 100% customizable to fit the presenter’s needs.