Conflict Resolution Chart PowerPoint Template
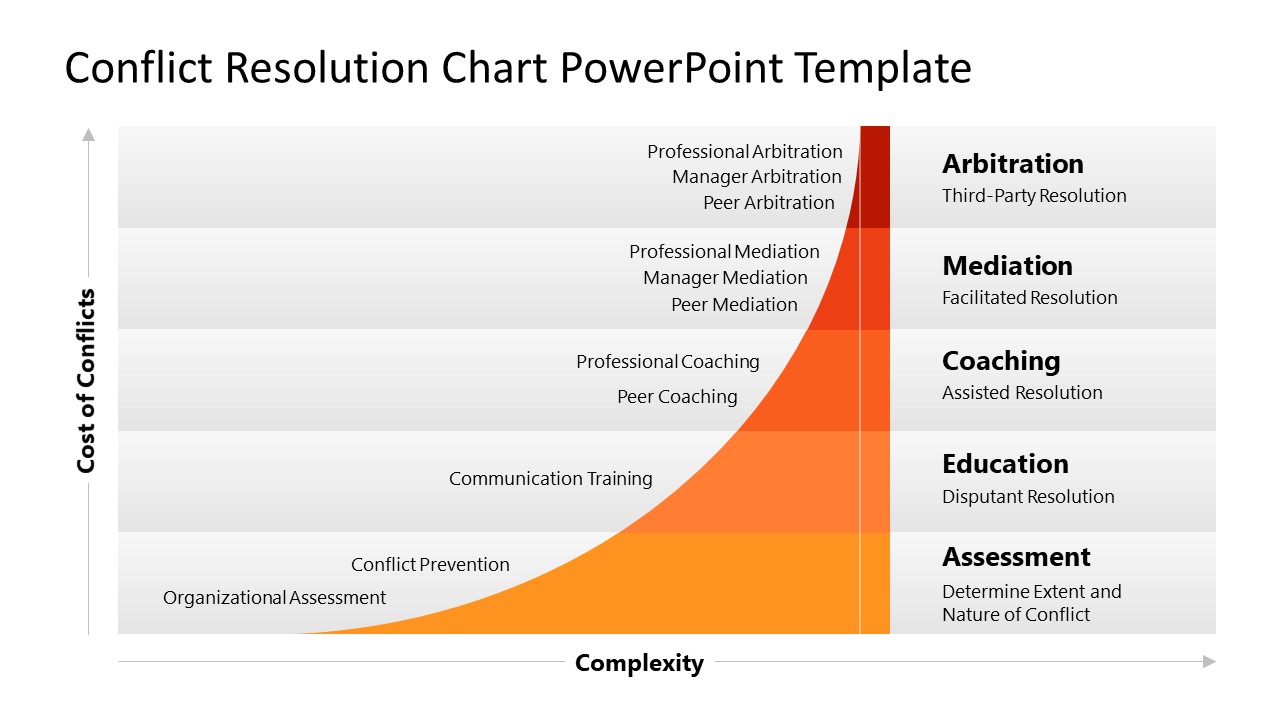
Present the strategy and methods for resolving organizational disputes using our Conflict Resolution Chart PowerPoint Template in your stakeholder meetings. Conflict resolution charts help professionals showcase various approaches to resolving conflicts within the company, tailored to the level of complexity. The chart has two axes. The horizontal axis represents the complexity of the dispute, while the vertical axis indicates the cost of conflicts, which increases with the complexity of the dispute. The upward slope indicates that a low-level problem can be solved at minimal cost, while a highly complex problem requires professional management and is expensive. You can display the following conflict levels and their relevant solution methods based on the problem level on the first slide. Starting from the bottom:
- Assessment: Determine the extent and nature of the conflict, and the methods to solve the conflict, including organizational assessment and conflict prevention.
- Education: Training people to manage disputes, companies can solve them via communication training.
- Coaching: Assisted resolution, and you can address with professional coaching and peer coaching.
- Mediation: Facilitated resolution. The methods to solve this problem are professional, managerial, or peer mediation.
- Arbitration: Third-party resolution( level that has highest cost). This can be resolved with professional, manager, or peer arbitration.
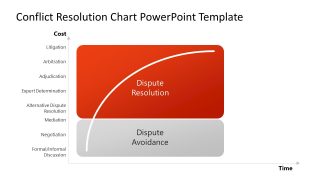
This conflict resolution PPT template is helpful for corporate trainers, project managers, business analysts, mentors, coaches, and data analysts. They can showcase their research findings to illustrate the methods for resolving company disputes and conflicts. Also, the conflict resolution template can be used in HR sessions and workshops, including training presentations and employee onboarding slides. The second slide also resonates with conflict resolution, but with a different approach. Using the second slide, you can illustrate how the cost of conflict increases over time if it remains unresolved. Professionals can be divided into two main zones: Dispute Avoidance (grey) & Dispute Resolution (red). Adjust the template labels and features to effectively showcase your strategies. Download the Conflict Resolution Chart slide template today!
Alternatively, you can download other conflict management PPT templates, fully compatible with PowerPoint & Google Slides presentations.


You must be logged in to download this file.
DOWNLOAD- Category
- Data & Charts
- Rating

 Loading...
- Size
- 16x9
- Item ID
- 22883-01
- Colors
Subscribe today and get immediate
access to download our PowerPoint templates.