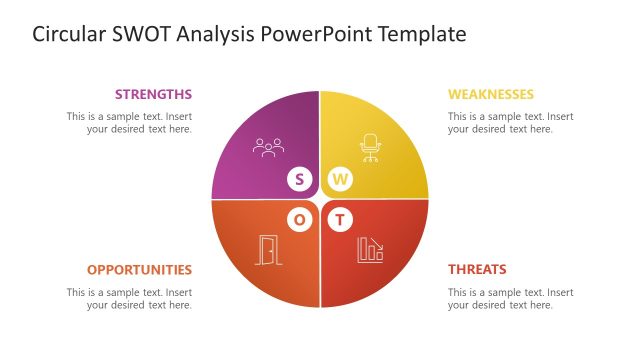
Slide 1 of 5 from Circular SWOT Analysis PowerPoint Template
Cover Slide – Circular SWOT Analysis PPT Template
Circular SWOT Analysis Diagram for Presentations
- Diagram
- Matrix Quadrant
- Strategic Analysis Slide
- 16:9
- 100% Editable
The Circular SWOT Analysis Diagram from the Circular SWOT Analysis PowerPoint Template offers a clear and visually balanced layout for strategic planning and market analysis. This slide template integrates editable shapes and vector icons to represent strengths, weaknesses, opportunities, and threats, making it suitable for business presentations and team brainstorming sessions. Its circular design supports a seamless flow of information, enhancing the effectiveness of corporate presentations and slide decks focused on strategic insights.
What’s on This Slide
The layout features a circular diagram divided into four quadrants labeled Strengths, Weaknesses, Opportunities, and Threats. Each section contains a placeholder for text, aligned centrally within the quadrant. The central area is empty, creating a focal point. The colors used are blue for Strengths, orange for Weaknesses, yellow for Opportunities, and gray for Threats, with icons representing each category positioned at the outer edges. The overall composition is symmetrical, emphasizing the circular flow of the SWOT analysis.
How to Use It
This layout serves as a visual representation of a SWOT analysis, ideal for summarizing strengths, weaknesses, opportunities, and threats in a business context. It fits well at the beginning of a presentation to outline strategic considerations. This structure is useful for team discussions, strategic planning sessions, or market analysis presentations, allowing for a clear and concise overview of key factors affecting a project or organization.
Text Placeholders & Capacity
Keep your copy within these limits so it fits without resizing. Node body slots can accommodate roughly 25-30 words each.
| Placeholder | Count | Max characters (approx.) |
|---|---|---|
| Item heading | 4 | 20 |
| Item body | 4 | 150 |
Slide Keywords
Download unlimited PowerPoint templates, charts and graphics for your presentations with our annual plan.
DOWNLOADReturn to Circular SWOT Analysis PowerPoint Template.