Circles Versus Infographic PowerPoint Template
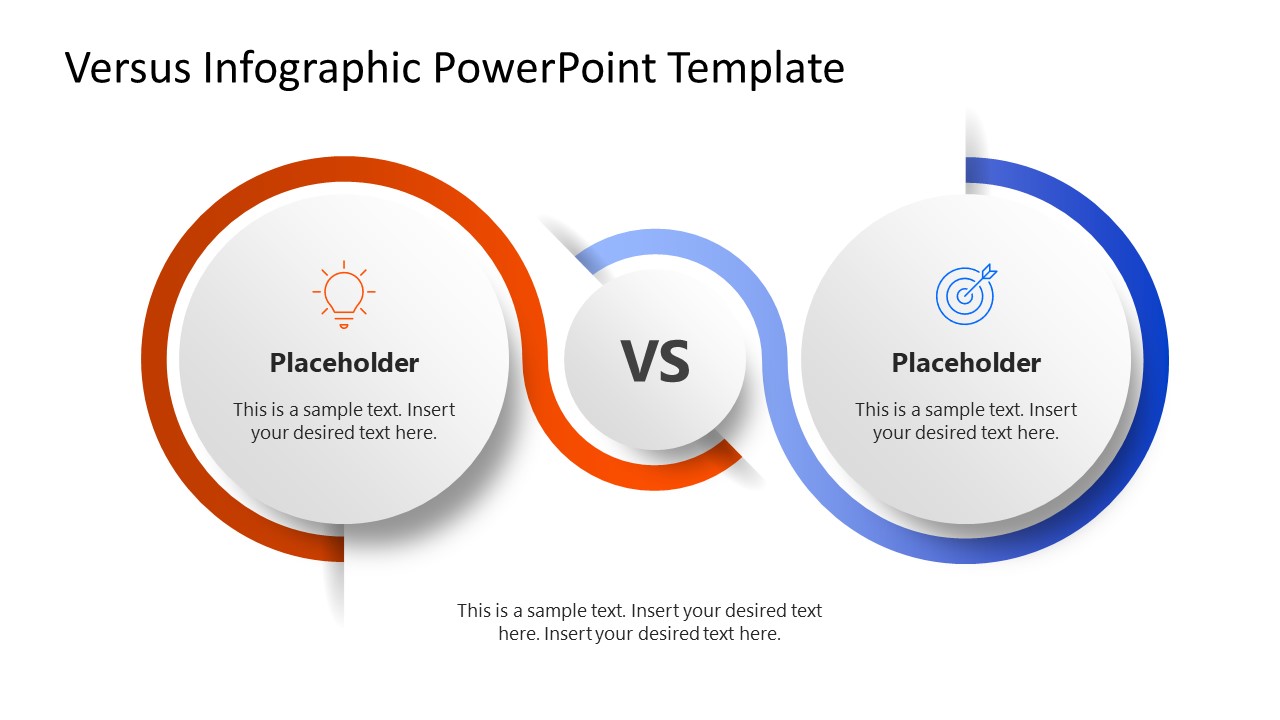
Visualize the performance comparison of two project teams in the executive sessions with our Circles Versus Infographic PowerPoint Template. The template shows two larger circular shapes, each containing an infographic icon, title text, and a placeholder description line. There is a central share showing the versus symbol. Red and blue lines emerge from the central shape and cover the left and right circles, respectively, giving it a loop-like appearance. This also enhances the design’s visuals, helping the presenters engage the audience and communicate their thoughts effectively. This slide layout includes 100% editable elements compatible with legacy versions of Microsoft PowerPoint.
The Circles Versus Infographic PowerPoint Template has two slides with the same diagram, but both differ in background colors. The first slide has a white background, while the second one has a dark background. At the bottom, you can mention essential notes by editing the placeholder text lines. Furthermore, users can modify the shapes, icons, or infographics in the template to perfectly match their presentation needs. They can also repurpose the template for project proposals or investor pitch decks. When should you use this deck?
- Mentors can use this comparison template to present the difference between personal development and leadership development in corporate training.
- The circles comparion template helps project managers showcase two strategies with different impacts on the system.
- Marketers can compare two marketing platforms for business growth and development using this template.
- It is also useful for comparing the performance of two systems, teams, or processes at business meetups.
Adjust the design’s graphical layout to your needs. Download the circle verses infographic slide layout for your academic sessions and discuss key concepts effectively!
Alternatively, you can download toher comparison slide templates to use in your presentations, fully compatible with PowerPoint and Google Slides.

You must be logged in to download this file.
DOWNLOAD- Category
- Diagrams
- Rating

 Loading...
- Size
- 16x9
- Item ID
- 23376-01
- Colors
Subscribe today and get immediate
access to download our PowerPoint templates.