Slide 14 of 22 from Carioca PowerPoint Template
World Map and Data Drive Chat
Market Analysis Slide for Presentations
- Chart
- Bar Vertical
- Context Slide
- 16:9
- 100% Editable
What’s on This Slide
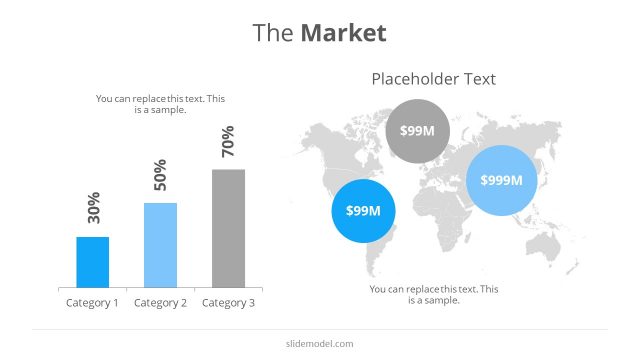
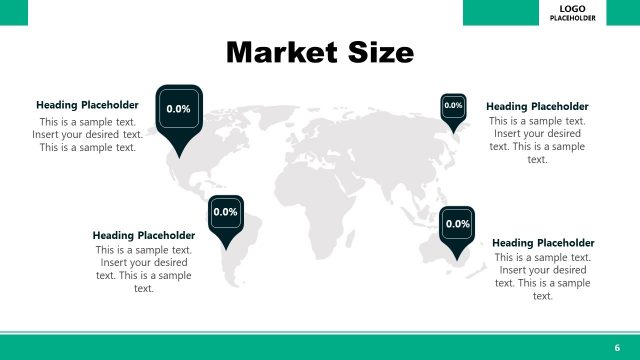
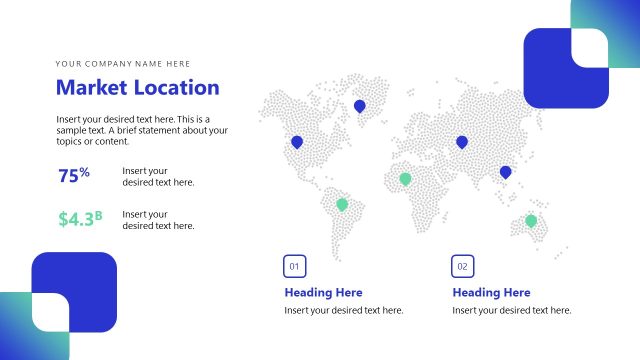
The layout features a left-aligned bar chart displaying three categories with corresponding percentages: 30%, 50%, and 70%. The bars are colored blue, green, and purple, respectively. To the right, a world map is present, with three circular nodes indicating monetary values of $99M and $999M, each in distinct colors: blue, purple, and green. Text placeholders are positioned above the chart and below the map, indicating where to insert titles and descriptions. The overall composition is balanced, with a clear visual hierarchy between the chart and map.
How to Use It
This layout serves as a market analysis overview, effectively comparing categories and highlighting financial figures across regions. It fits well in a presentation sequence following competitor analysis or market research slides. This structure is suitable for business scenarios such as sales pitches, investment proposals, or strategic planning discussions, where visual data representation is essential for conveying market insights.
Text Placeholders & Capacity
Keep your copy within these limits so it fits without resizing. Body slots can accommodate roughly 8-10 words each.
| Placeholder | Count | Max characters (approx.) |
|---|---|---|
| Slide title | 1 | 30 |
| Body paragraph | 2 | 50 |
| Item heading | 3 | 10 |
| Item body | 3 | 10 |
Slide Keywords
Download unlimited PowerPoint templates, charts and graphics for your presentations with our annual plan.
DOWNLOADReturn to Carioca PowerPoint Template.