Slide 23 of 51 from #3 Ultimate Pitch Deck PowerPoint Template
7757-01-ultimate-pitch-deck-powerpoint-template-16×9-22
Market Overview Chart Slide
- Chart
- Bar Horizontal
- Context Slide
- 16:9
- 100% Editable
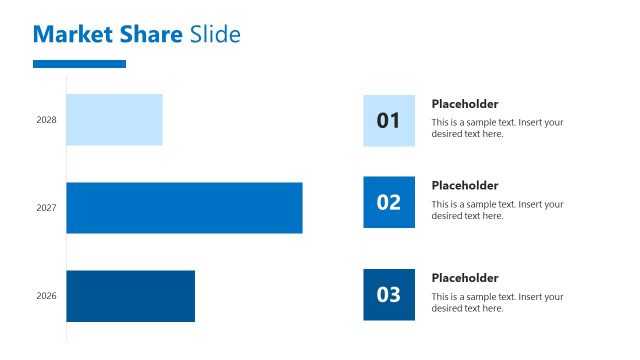
The Market Overview Chart slide from the #3 Ultimate Pitch Deck PowerPoint Template provides a clear horizontal bar chart layout ideal for presenting market trends and performance metrics. This slide template supports business presentations by combining editable slides with structured data visualization, enhancing investor pitches and strategic planning through concise market analysis.
What’s on This Slide
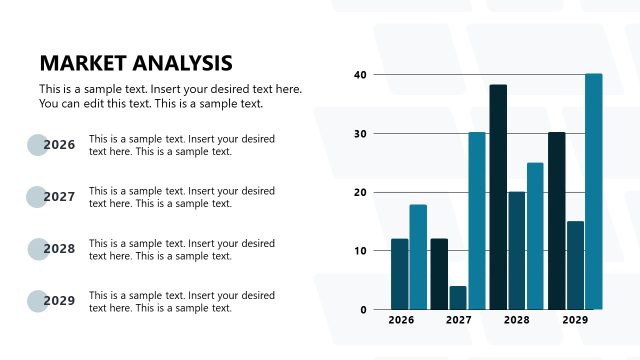
The slide features a horizontal bar chart positioned at the top, displaying market data for the years 2018 to 2021. Each year is labeled on the left, with corresponding blue bars indicating values. Below the chart, there are three rectangular text placeholders arranged horizontally, each with a light blue background. The placeholders are designed for text input, with the first two containing sample text. The overall layout is clean, with a white background and a clear visual hierarchy emphasizing the chart and the text areas.
How to Use It
This layout serves as a market overview slide, ideal for presenting market trends or performance metrics over multiple years. It fits well in a presentation sequence following problem identification and solution proposals. This structure is useful in business contexts such as investor pitches, market analysis reports, or strategic planning sessions, where clear data visualization is essential for decision-making.
Text Placeholders & Capacity
Keep your copy within these limits so it fits without resizing. Node labels can accommodate around 15 characters each, while body text can hold about 80 characters.
| Placeholder | Count | Max characters (approx.) |
|---|---|---|
| Chart title | 1 | 30 |
| Item heading | 4 | 15 |
| Item body | 3 | 80 |
Slide Keywords
Download unlimited PowerPoint templates, charts and graphics for your presentations with our annual plan.
DOWNLOADReturn to #3 Ultimate Pitch Deck PowerPoint Template.