Slide 1 of 2 from Business KPI Slide PowerPoint Template
Business KPI Slide Presentation Template
KPI Dashboard Slide for Business Presentations
- Chart
- Dashboard Composite
- Kpi Reporting Slide
- 16:9
- 100% Editable
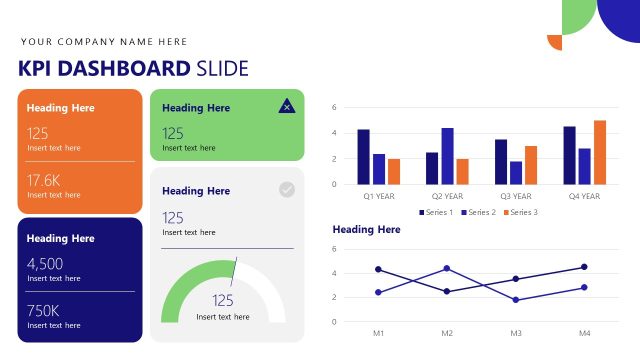
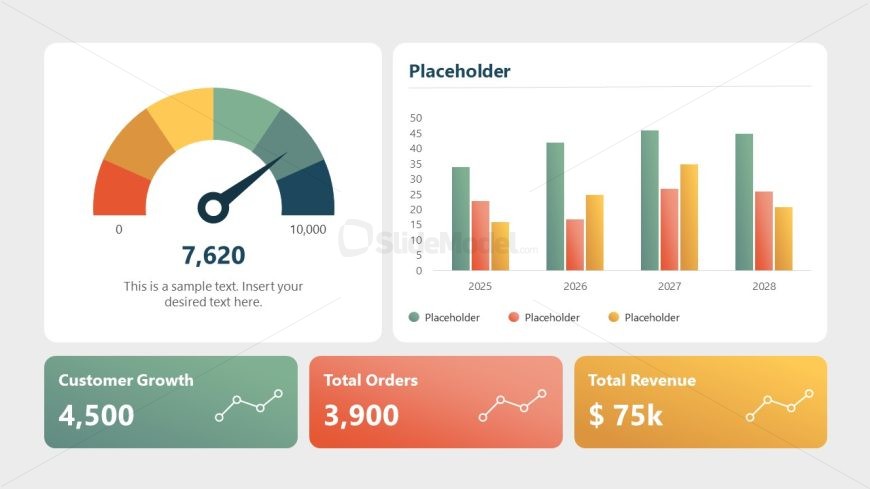
The KPI Dashboard with Charts slide from the Business KPI Slide PowerPoint Template offers a clear and balanced layout for presenting key performance indicators. This slide template integrates editable shapes and vector icons to visualize quarterly performance through gauge and clustered bar charts, complemented by KPI metric cards. It is well-suited for corporate presentations and business strategy meetings requiring concise data communication within a professional slide deck.
What’s on This Slide
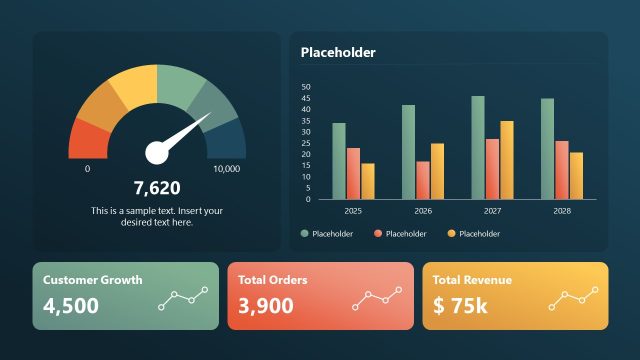
The layout features a gauge chart on the left, displaying a value of 7,620 against a range from 0 to 10,000. To the right, a clustered bar chart presents data for multiple years, with color-coded bars representing different metrics. Below the charts, three KPI metric cards show customer growth, total orders, and total revenue, each with distinct background colors. Text placeholders are present for titles and data labels, aligned centrally within their respective areas. The overall composition is balanced, with a light background enhancing visibility.
How to Use It
This layout serves as a KPI dashboard, ideal for presenting key performance indicators in business contexts. It fits well in a presentation sequence following an overview or introduction slide, providing a detailed performance snapshot. Suitable scenarios include quarterly business reviews, performance tracking meetings, and strategic planning sessions. The structure allows for quick data interpretation, making it effective for managers and analysts to communicate results clearly.
Text Placeholders & Capacity
Keep your copy within these limits so it fits without resizing. Node labels can accommodate around 3-5 words each, while the chart title can hold about 8-10 words.
| Placeholder | Count | Max characters (approx.) |
|---|---|---|
| Chart title | 1 | 50 |
| Item heading | 3 | 30 |
| Item body | 3 | 10 |
| Data label | 1 | 10 |
Slide Keywords
Download unlimited PowerPoint templates, charts and graphics for your presentations with our annual plan.
DOWNLOADReturn to Business KPI Slide PowerPoint Template.