Slide 11 of 15 from Blue Circle Professional PowerPoint Template
10011-blue-circle-slidemodel-template-0001-11
Pie Chart Slide for Presentations
- Chart
- Pie Chart
- Evaluation Slide
- 16:9
- 100% Editable
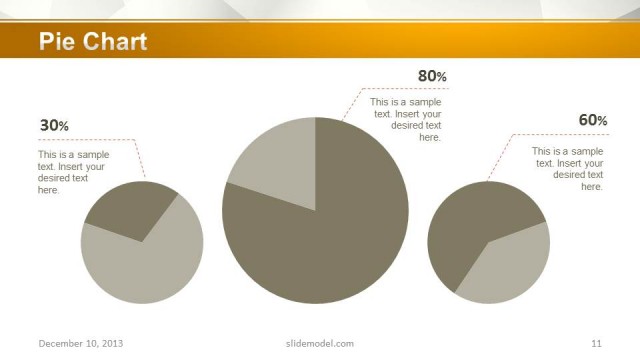
The Pie Chart slide layout from the Blue Circle Professional PowerPoint Template offers a clear visual method to present market share analysis, budget distribution, or survey results. Featuring three staggered pie charts with percentage labels and descriptive text placeholders, this slide supports effective data evaluation in business presentations. Its design integrates solid color fills and a blue gradient background, making it a practical choice for slide decks requiring precise visual communication using editable shapes and vector icons.
What’s on This Slide
The layout features three pie charts positioned in a staggered arrangement across the slide. The largest chart is centered, while the smaller charts are placed to the left and right. Each chart displays a percentage label, with accompanying text placeholders beneath them for descriptive content. The charts are filled with solid colors, with the largest chart in blue, the medium chart in light gray, and the smallest in a lighter shade. The background includes a gradient of blue tones, enhancing visual appeal. The title is prominently displayed at the top left in bold white text.
How to Use It
This layout serves to visually represent data distributions through pie charts, making it suitable for illustrating proportions in business presentations. It fits well in a sequence following a data introduction or overview slide. This slide is ideal for scenarios such as presenting market share, survey results, or budget allocations. It can be used to compare different categories or segments within a single topic, allowing for clear visual communication of data insights.
Text Placeholders & Capacity
Keep your copy within these limits so it fits without resizing. Data labels can hold approximately 3-5 words each.
| Placeholder | Count | Max characters (approx.) |
|---|---|---|
| Chart title | 1 | 30 |
| Data label | 3 | 20 |
| Item body | 3 | 50 |
Slide Keywords
Download unlimited PowerPoint templates, charts and graphics for your presentations with our annual plan.
DOWNLOADReturn to Blue Circle Professional PowerPoint Template.