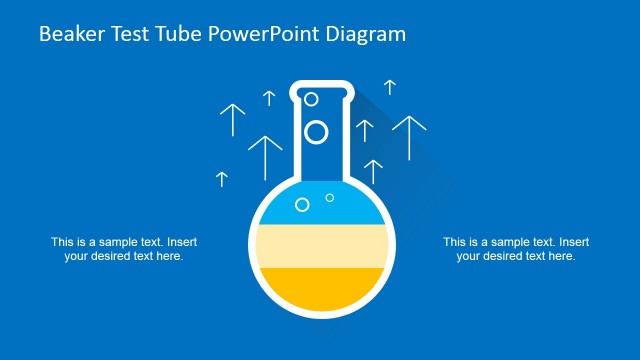
Measuring Success Using PowerPoint Test Tube Chart
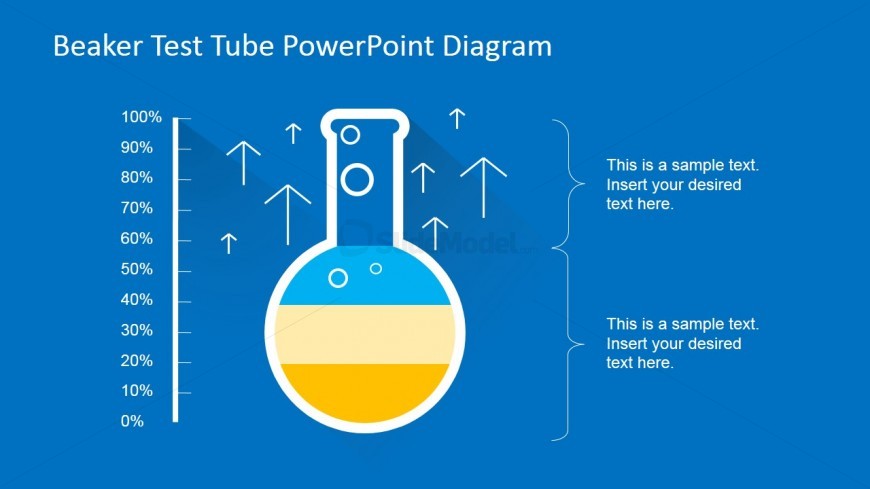
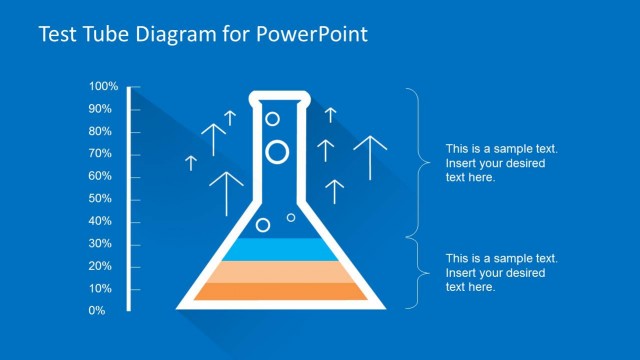
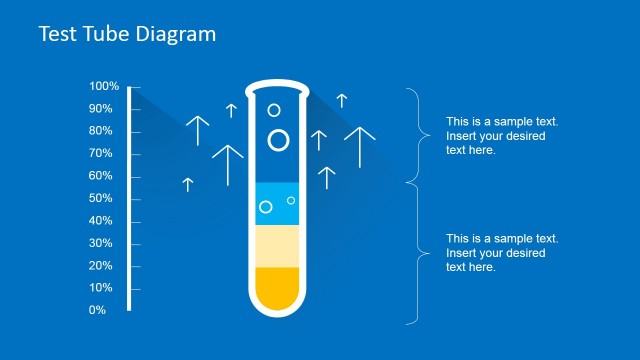
This PowerPoint slide is suitable for Measuring Success Using PowerPoint test tube chart. The presenter may use the Office template in tracking the success of advertising. It shows a ruler with a range of 0% to 100%. It may represent the business plan’s level of success.
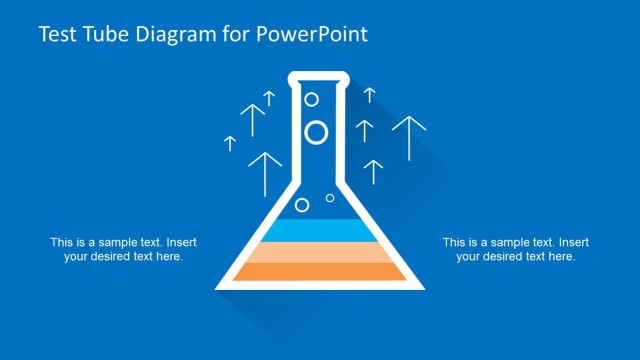
The test tube drawing beside the ruler is used to measure illustrate this success, using colored liquids. Upward arrows and bubbles accompany the PowerPoint graphic. Two text placeholders found in the slide design may be used to insert relevant information. All PowerPoint objects are 100% editable and can be edited to the presenter’s needs.
Return to Beaker Test Tube PowerPoint Diagram.