This is an animated template for Microsoft PowerPoint containing several business slides that you can use to present data in a PowerPoint presentation. Inside this presentation template with rainbow colors you can find useful slides including comparison slides for PowerPoint, timelines with pie charts as milestones, data charts and chevron process flows with colorful steps and creative styles.
You can also take advantage of the presentation content slides and agenda slides to present your content or key concepts.
What’s inside this template
Example presentation scenarios
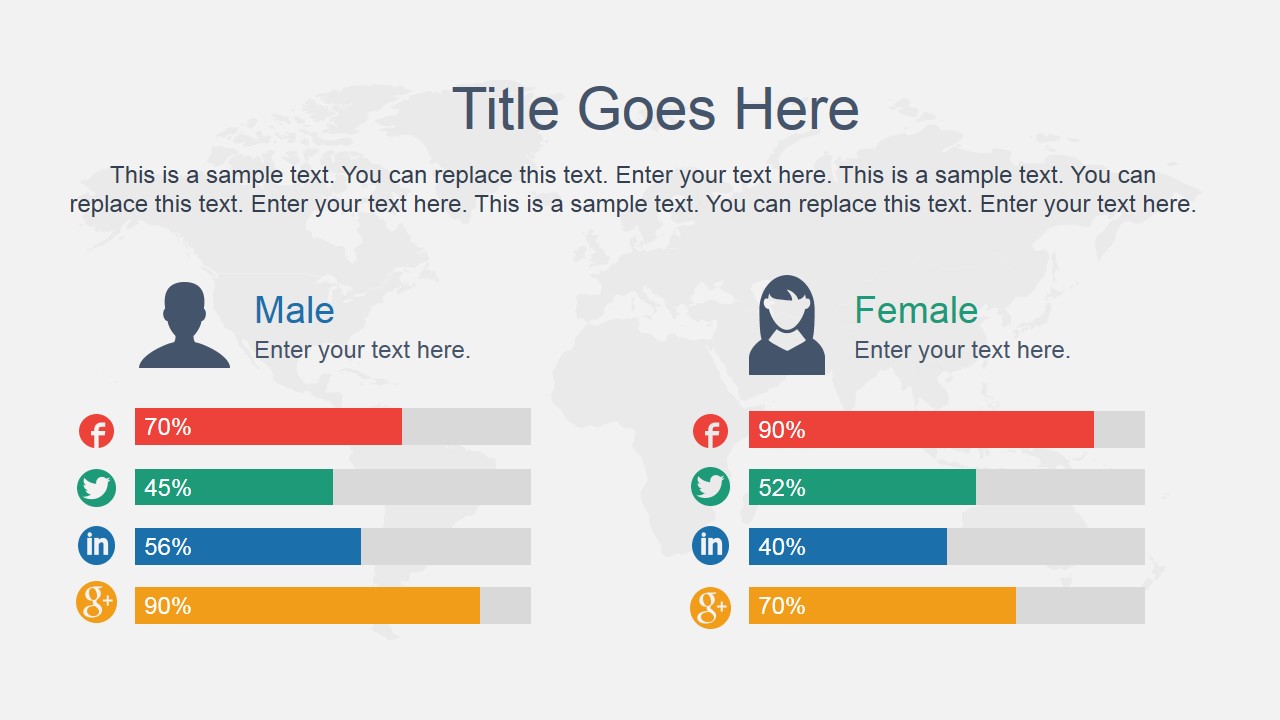
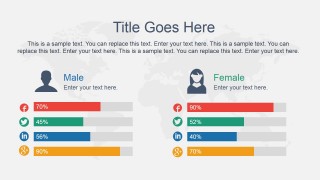
- A marketing manager can present audience differences by using the male and female comparison bars to show demographic or channel performance patterns.
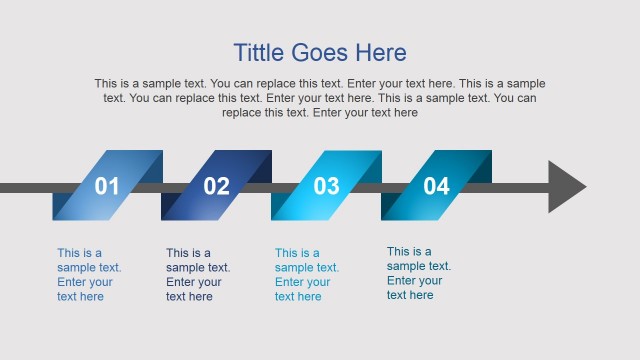
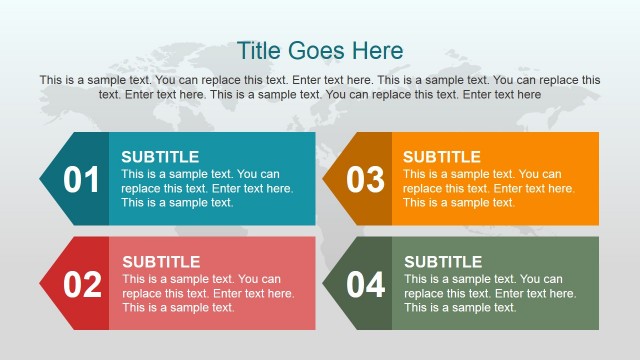
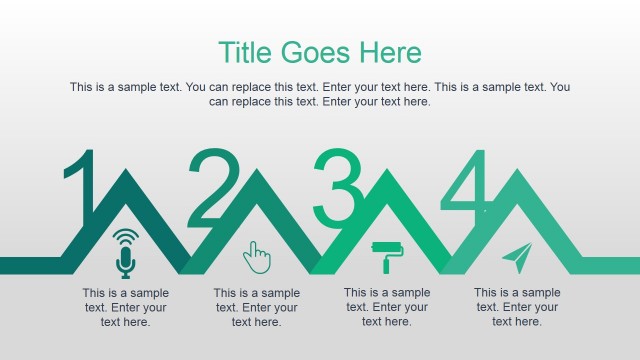
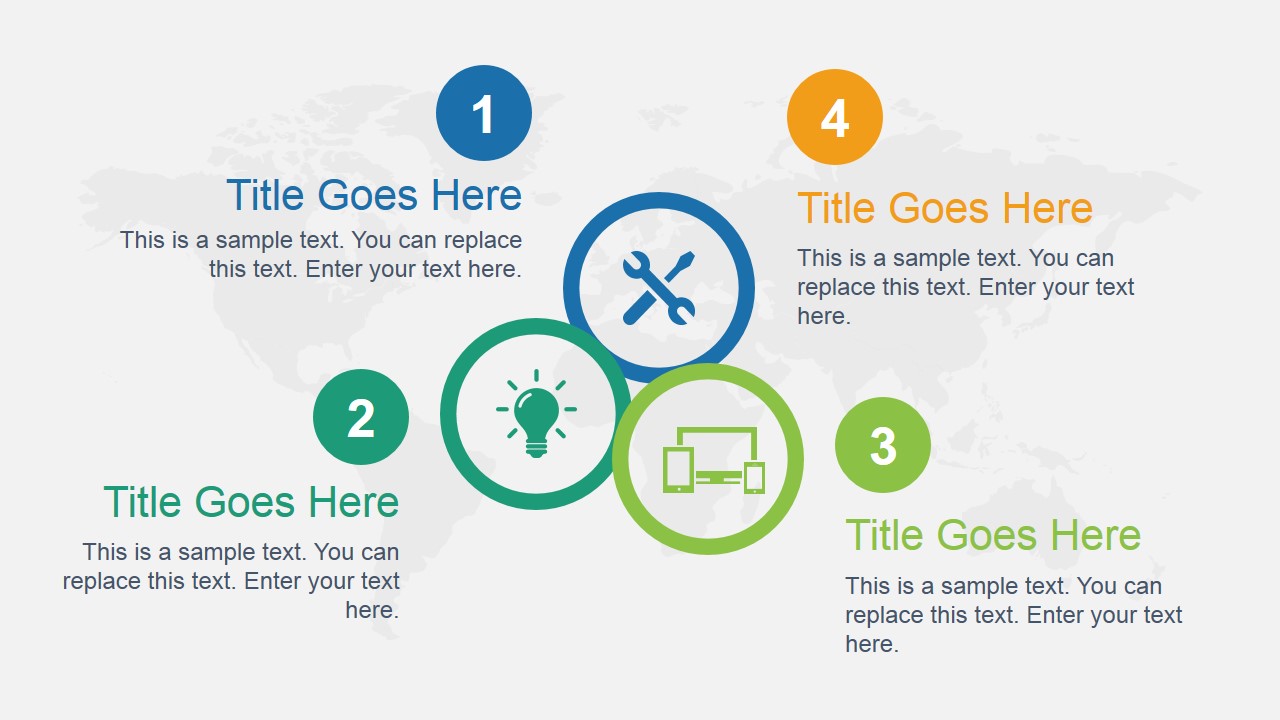
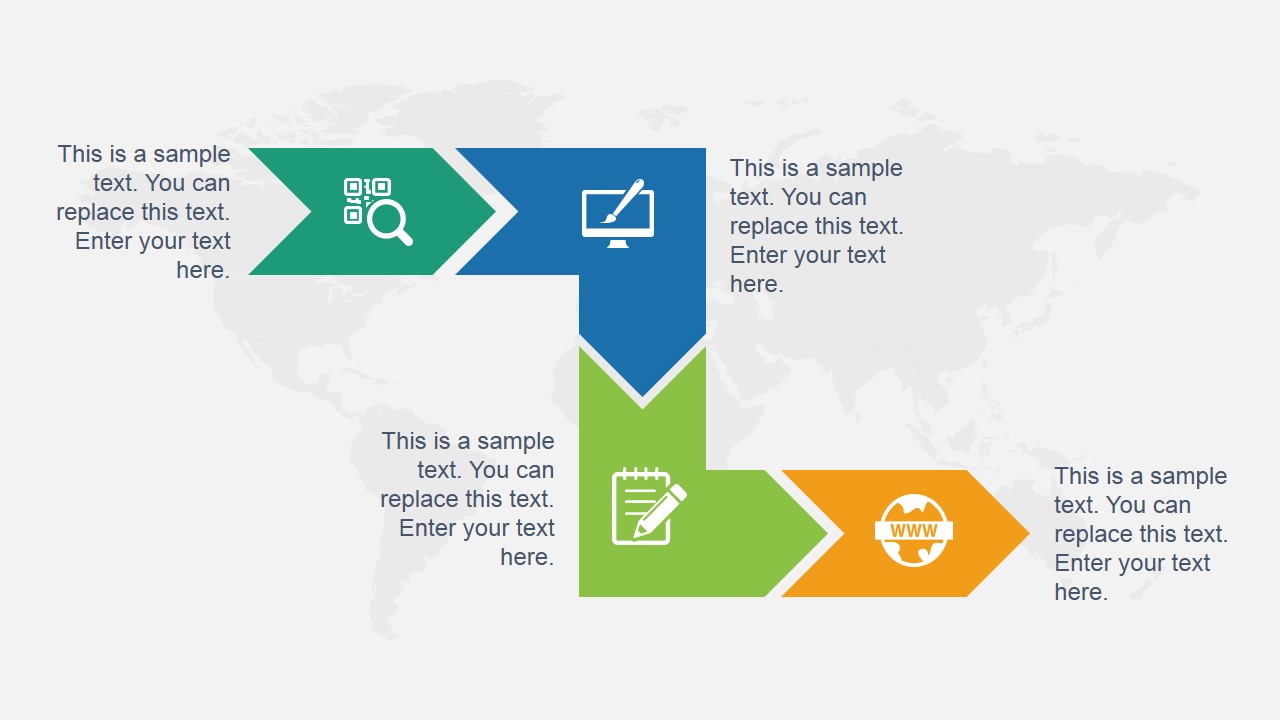
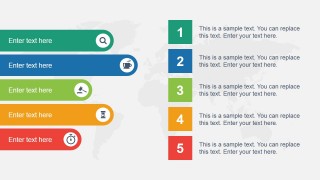
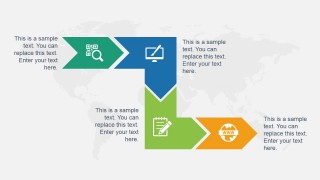
- An operations lead can explain a workflow by using the numbered agenda slide and chevron process flow to connect tasks, owners, and handoffs.
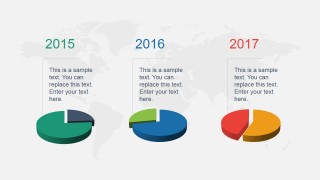
- A project manager can summarize annual progress by using the pie chart timeline to show milestone status across sequential years.
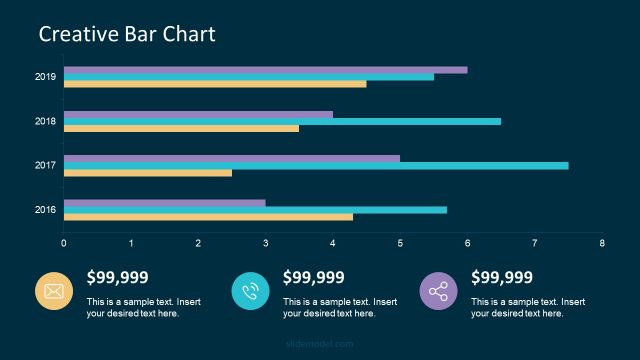
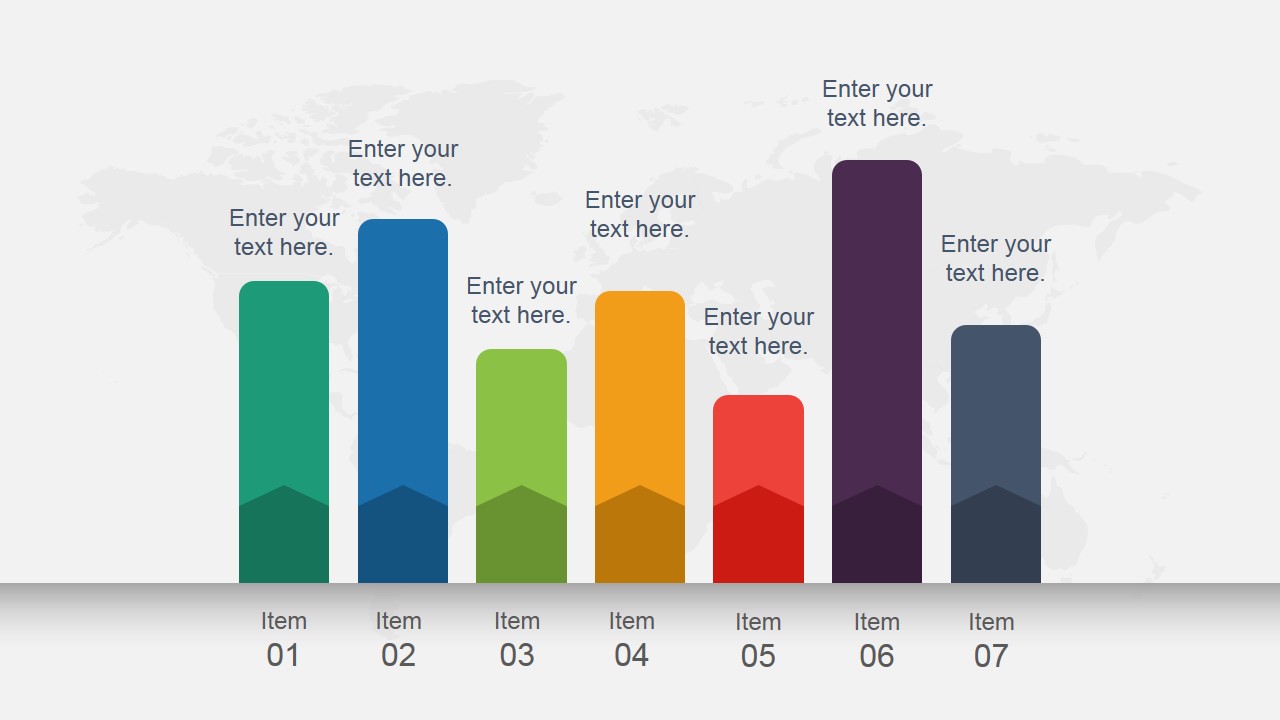
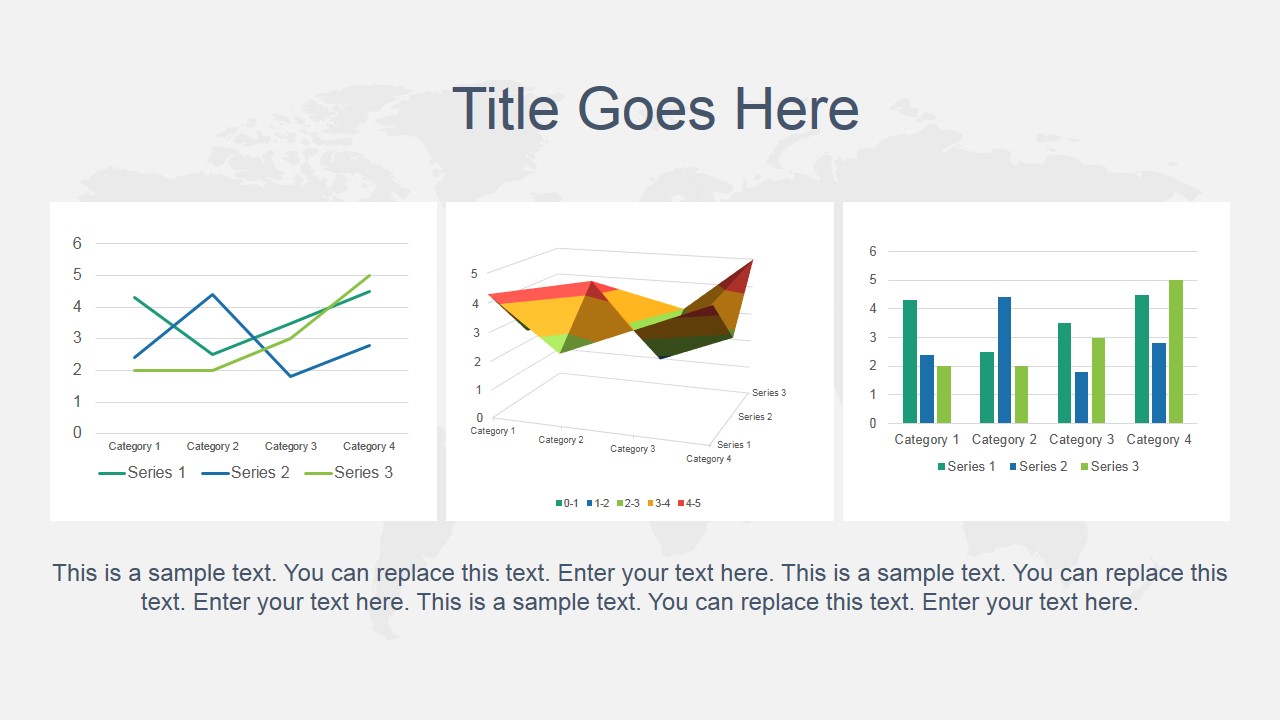
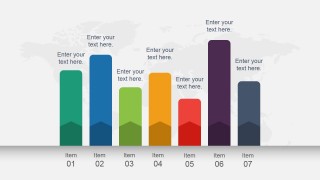
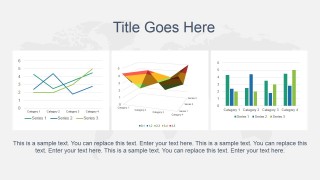
- A business analyst can report key indicators by using the vertical bar chart and multi-chart dashboard to compare categories and discuss results.
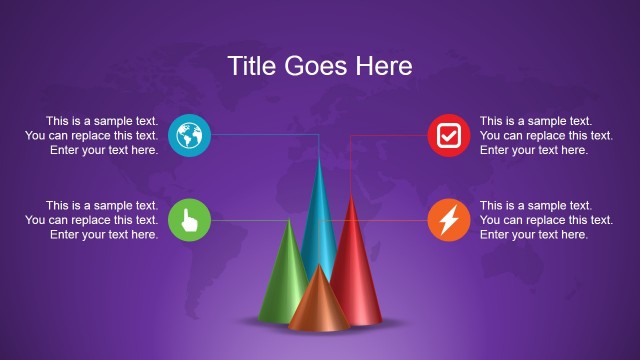
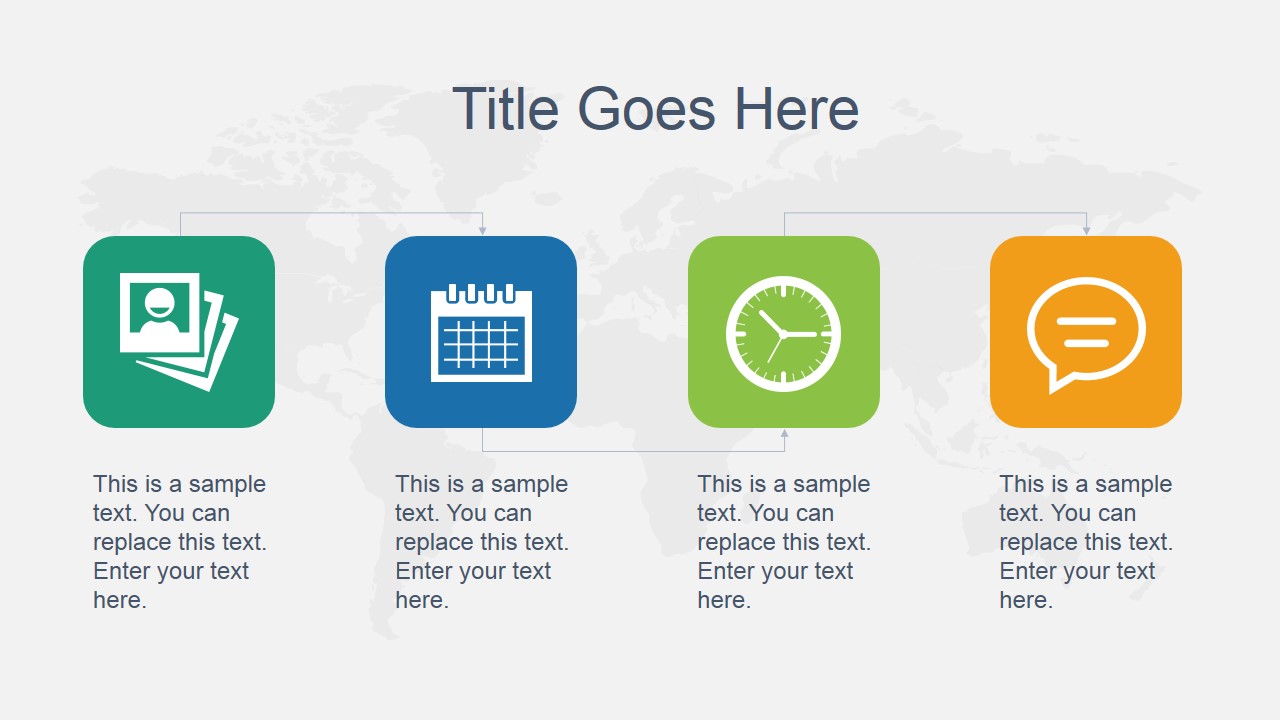
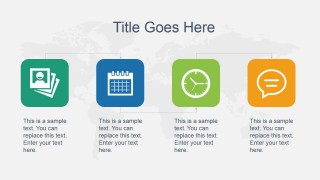
- A consultant can structure a client workshop by using the four icon columns to introduce focus areas such as documents, scheduling, timing, and communication.
Features
- 100% editable presentation template
- Compatible with Microsoft PowerPoint and Google Slides
- 16:9 aspect ratio slides
- Scalable vector shapes, icons and illustrations
- Ready with Animations & Transitions in PowerPoint
- AI-Ready for Microsoft Copilot and Claude
- Instant access and download
Frequently asked questions
Q: How should a presenter organize a business update with these layouts?
A: Start with the title and comparison slide to define the audience or baseline, then move into the numbered agenda so listeners know the structure. Use the bar chart and pie chart timeline for evidence, and place the chevron process flow near the end to translate findings into concrete next steps.
Q: Who is this template best suited for in a business setting?
A: It fits managers, consultants, marketers, and analysts who need to explain several related business points without building a full report deck. The demographic bars help compare groups, the charts support metric discussion, and the icon columns work well for summarizing priorities in staff meetings, client updates, or planning workshops.
Q: Why does the rainbow visual system help the message?
A: The rainbow colors act as a recognition system across different slide types. A green or orange step can stay mentally linked as the presenter moves from list to process flow to chart. That repetition reduces audience effort and makes multi-part information easier to scan during animated delivery.


Animated Rainbow Business PowerPoint Template
8-slide animated presentation template with rainbow process flows, comparison bars, and business charts
Animated Rainbow Business PowerPoint Template is an 8-slide business template for Microsoft PowerPoint and Google Slides. It includes demographic comparison bars, a numbered agenda/process list, a vertical bar chart, a pie chart timeline, a chevron process flow, and a multi-chart dashboard for business presenters working in 16:9 format.
- Category
- Template Backgrounds
- Rating


 Loading...
- Aspect ratio
- 16:9
- Item ID
- 4061-01
- Colors
 Microsoft PowerPoint
  Microsoft Copilot
  Claude for PowerPoint
 Other formats supported
Subscribe today and get immediate
access to download our PowerPoint templates.