Cone Chart Slide Design for PowerPoint

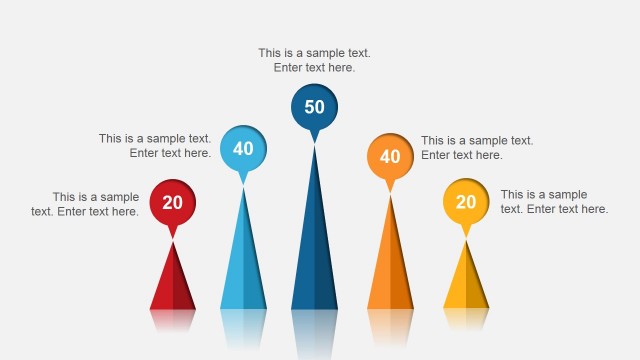
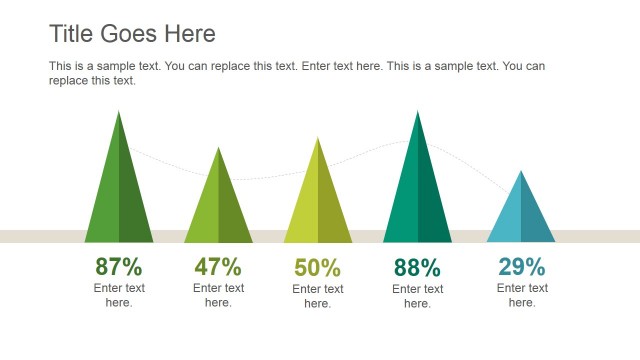
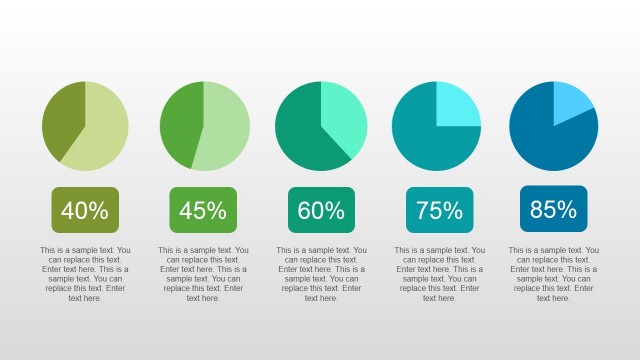
This cone chart slide design for PowerPoint has the same function as that of a typical bar graph that is to show a set of statistical data for different elements so as to be compared. In a business setting, this chart may be used to compare business statistics for five different branches or departments, such as volume in sales or amount of expenses.
The PowerPoint slide contains five cones colored dark blue, pastel blue, light blue, pastel green, and yellow green, each with a circular dialog bubble containing a percentage and a text placeholder where descriptions and labels may be inserted. The PowerPoint objects are 100% editable to suit the presenter’s needs and preferences.
Return to Analysis PowerPoint Template.