Circular Data Chart Slide Design for PowerPoint
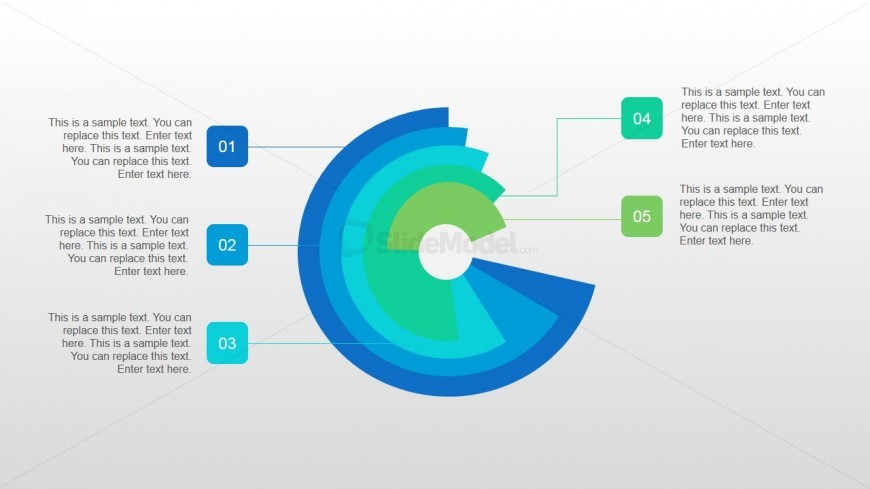
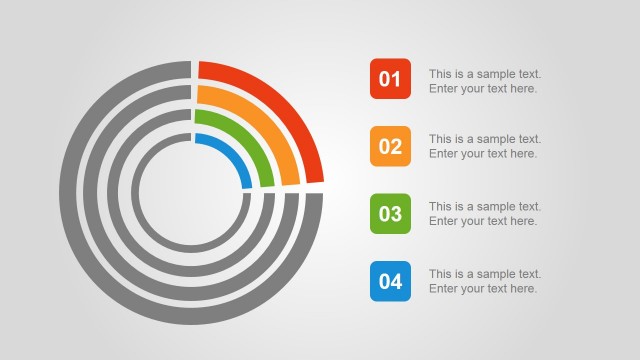
The circular data chart slide design for PowerPoint found on this Office template may be used to present business statistics in percentages, such as market shares in different areas or branches, or the percent of completion of specified business plans. The PowerPoint shape may be likened to a circular loading icon, as showing percentages the same way as a set of superimposed pie chart.
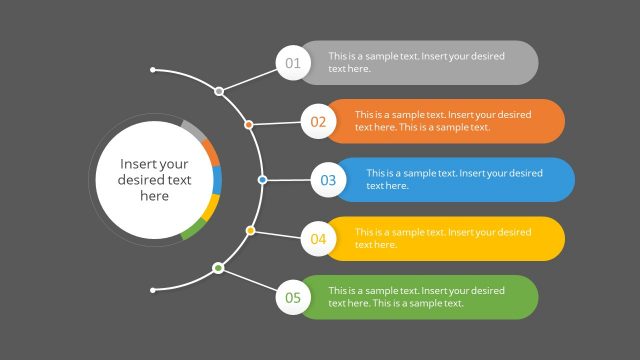
The shapes are colored in dark blue, pastel blue, light blue, pastel green, and yellow green, and are connected to shapes containing the numbers one through five by a thin line. Each number has a corresponding text placeholder beside it where descriptions for each element found in the PowerPoint slide may be inserted. All PowerPoint objects are 100% customizable to suit the presenter’s needs and preferences.
Return to Analysis PowerPoint Template.