Slide 14 of 15 from AI Workforce Transition PowerPoint Template
Editable Case Study & Success Story Slide – AI Workforce Transition Template
Case Study & Success Story Slide
- Diagram
- Other
- Case Study Slide
- 16:9
- 100% Editable
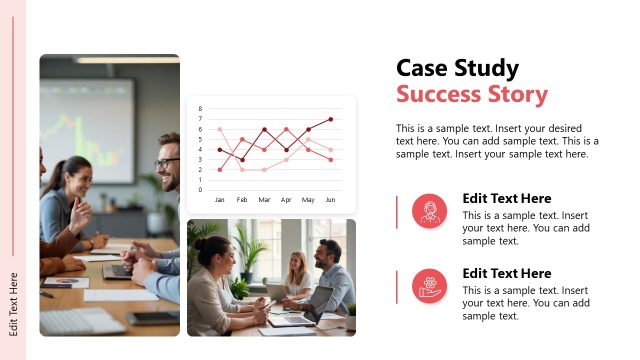
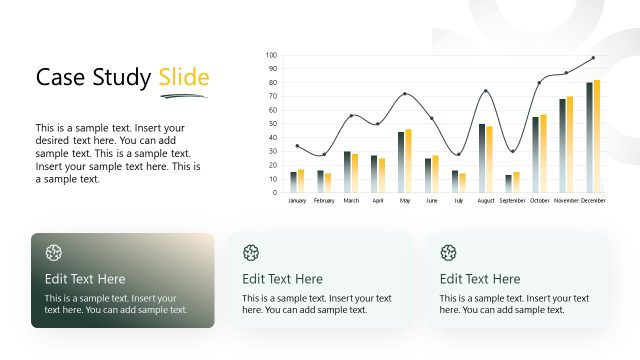
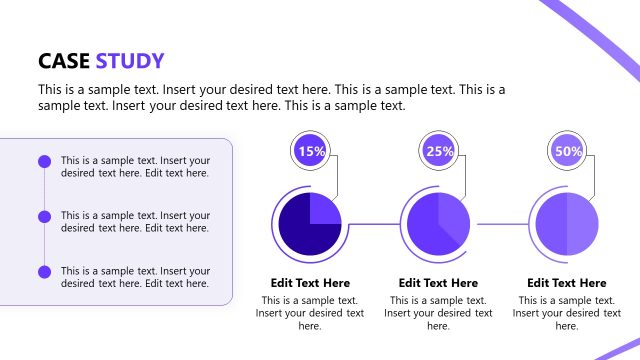
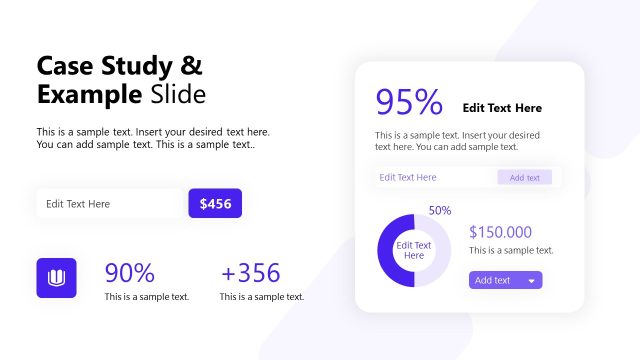
The Case Study & Success Story slide from the AI Workforce Transition PowerPoint Template offers a structured layout ideal for presenting project evaluations and performance reviews. Featuring editable shapes and data visualization elements like progress indicators and bar charts, this slide supports clear communication of strategic planning outcomes within business presentations and slide decks.
What’s on This Slide
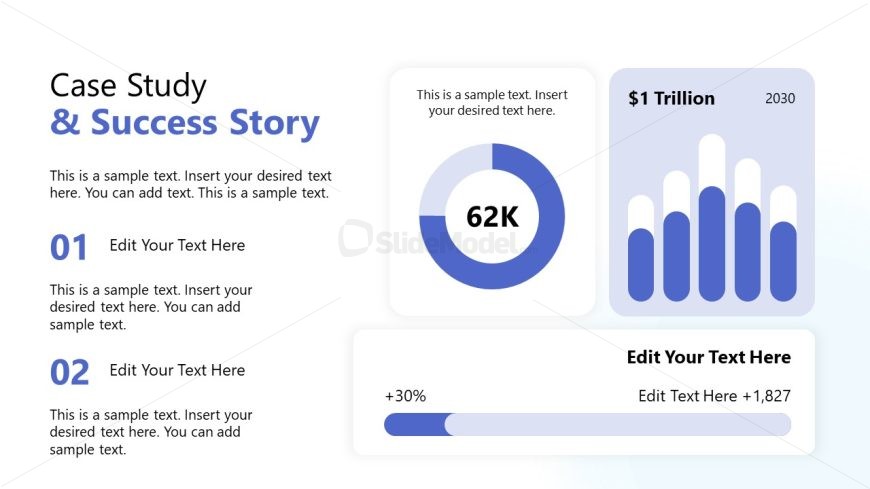
The layout features a left-aligned title at the top, followed by two numbered sections. The first section includes a circular progress indicator displaying '62K' in the center, with a light blue and dark blue color scheme. Below, a horizontal progress bar indicates a '+30%' increase. To the right, a bar chart visualizes data with a label '$1 Trillion' above and '2030' below. Text placeholders are present throughout, aligned to the left and right, with varying sizes to indicate hierarchy. The background is light with a subtle gradient.
How to Use It
This layout serves to present a case study and success story, making it suitable for showcasing project outcomes or performance metrics. It fits well in a presentation sequence after problem framing or analysis slides. This structure is beneficial for business scenarios where results need to be highlighted, such as project evaluations, performance reviews, or strategic planning discussions. It effectively combines narrative and visual data representation.
Text Placeholders & Capacity
Keep your copy within these limits so it fits without resizing. Body slots can accommodate around 15 words each.
| Placeholder | Count | Max characters (approx.) |
|---|---|---|
| Slide title | 1 | 30 |
| Item heading | 2 | 15 |
| Item body | 2 | 100 |
| Chart title | 1 | 20 |
| Data label | 1 | 10 |
| Kpi value | 1 | 10 |
| Kpi caption | 1 | 10 |
Slide Keywords
Download unlimited PowerPoint templates, charts and graphics for your presentations with our annual plan.
DOWNLOADReturn to AI Workforce Transition PowerPoint Template.