Slide 1 of 2 from 7-Scale Likert Infographic PowerPoint Template
Customizable 7-Scale Likert Infographic Presentation Layout
7-Scale Likert Diagram for Surveys
- Diagram
- Comparison Split
- Evaluation Slide
- 16:9
- 100% Editable
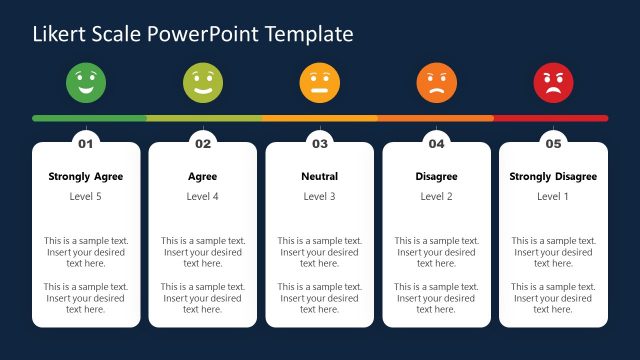
The 7-Scale Likert Diagram slide from the 7-Scale Likert Infographic PowerPoint Template offers a clear visual format for presenting survey results and user feedback analysis. This slide layout uses editable shapes and vector icons to represent varying agreement levels, making it suitable for corporate presentations and business presentation slide decks that require effective opinion poll summaries.
What’s on This Slide
The layout features seven vertical sections aligned horizontally. Each section contains an emoji icon representing a response option, with corresponding text placeholders below. The icons range from a red frown to a green smile, indicating varying levels of agreement. A horizontal gradient bar at the bottom visually connects the sections, transitioning from red to green. Text placeholders are centered within each section, with a consistent font size. The overall composition is balanced, with equal spacing between sections, creating a clear visual hierarchy.
How to Use It
This layout serves as a visual representation of a 7-point Likert scale for surveys or feedback forms. It is effective for displaying participant responses in a clear, engaging manner. This structure fits well in presentations discussing survey results, user feedback, or opinion polls. It can be used to summarize data in a visually appealing way, making it suitable for both academic and business contexts. The slide is best positioned after introducing the survey topic and before discussing detailed findings.
Text Placeholders & Capacity
Keep your copy within these limits so it fits without resizing. Node labels can hold up to 30 characters, while body text can hold around 50 characters each.
| Placeholder | Count | Max characters (approx.) |
|---|---|---|
| Item heading | 7 | 30 |
| Item body | 7 | 50 |
Slide Keywords
Download unlimited PowerPoint templates, charts and graphics for your presentations with our annual plan.
DOWNLOAD