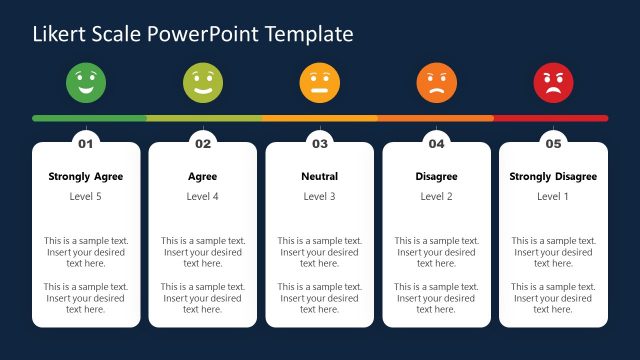
Slide 2 of 2 from 7-Scale Likert Infographic PowerPoint Template
7-Scale Likert Infographic Template Design
7-Scale Likert Chart for Surveys
- Diagram
- Other
- Evaluation Slide
- 16:9
- 100% Editable
The 7-Scale Likert Chart slide from the 7-Scale Likert Infographic PowerPoint Template offers a clear visual tool for presenting survey results and audience feedback. This diagram slide uses emoticon icons and a color gradient to illustrate varying sentiment levels, making it ideal for business presentations and market research. Its editable shapes and structured layout ensure easy customization within slide templates designed for opinion measurement and data analysis.
What’s on This Slide
The layout features a horizontal scale with seven emoticon icons representing varying levels of agreement. The icons are positioned evenly across the top, with labels beneath each icon indicating the corresponding sentiment from 'I Strongly Disagree' to 'I Strongly Agree.' A gradient color scheme transitions from red to green, visually indicating the scale's progression. A central arrow points downward to a text placeholder labeled 'Insert your desired text here,' which is centered below the scale. The overall composition is balanced, with clear visual hierarchy and alignment.
How to Use It
This layout serves as a visual representation of survey responses using a Likert scale format. It fits well in presentations that require audience feedback or opinion measurement. The structure allows for easy interpretation of sentiment levels, making it suitable for market research, employee satisfaction surveys, or academic studies. It can be used to summarize findings or to prompt discussion on survey results, fitting into a sequence that addresses data collection and analysis.
Text Placeholders & Capacity
Keep your copy within these limits so it fits without resizing. Node labels can hold about 30 characters each, while the body can accommodate roughly 40 characters.
| Placeholder | Count | Max characters (approx.) |
|---|---|---|
| Item heading | 7 | 30 |
| Body paragraph | 1 | 40 |
Slide Keywords
Download unlimited PowerPoint templates, charts and graphics for your presentations with our annual plan.
DOWNLOAD