The 4 Rows PowerPoint Table Process Flow Template is a creative table diagram template for presenting comparisons and process stages. Professionals can use this table template to represent their data in a well-organized and easy-to-present format. For instance, it can help create a process outline, where the columns can indicate the two major sections, and the rows can showcase the milestones or tasks to do. Similarly, it can help present the comparisons or contrasts, i.e., the key features can be mentioned in the rows, and columns can display the entities to be compared. Above both these examples, users can devise their use case for this creative 4-row PowerPoint table process diagram. The slides of this best PPT template can be easily customized using PowerPoint.
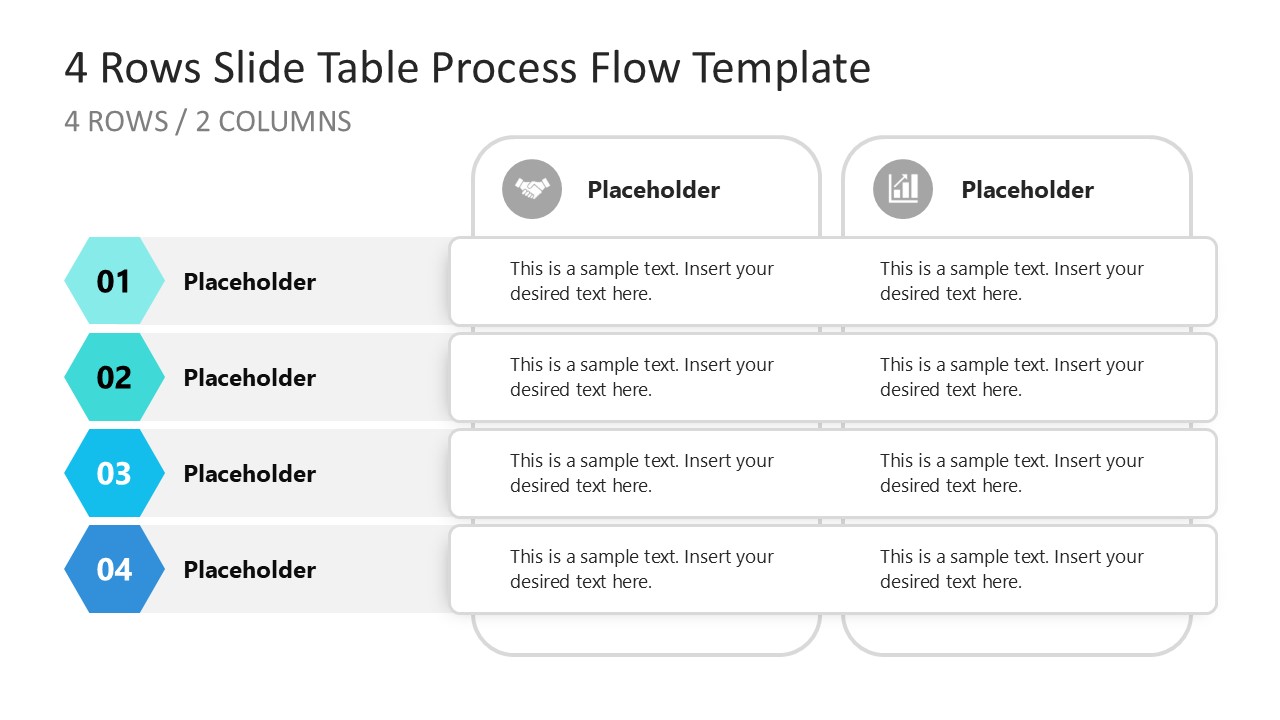
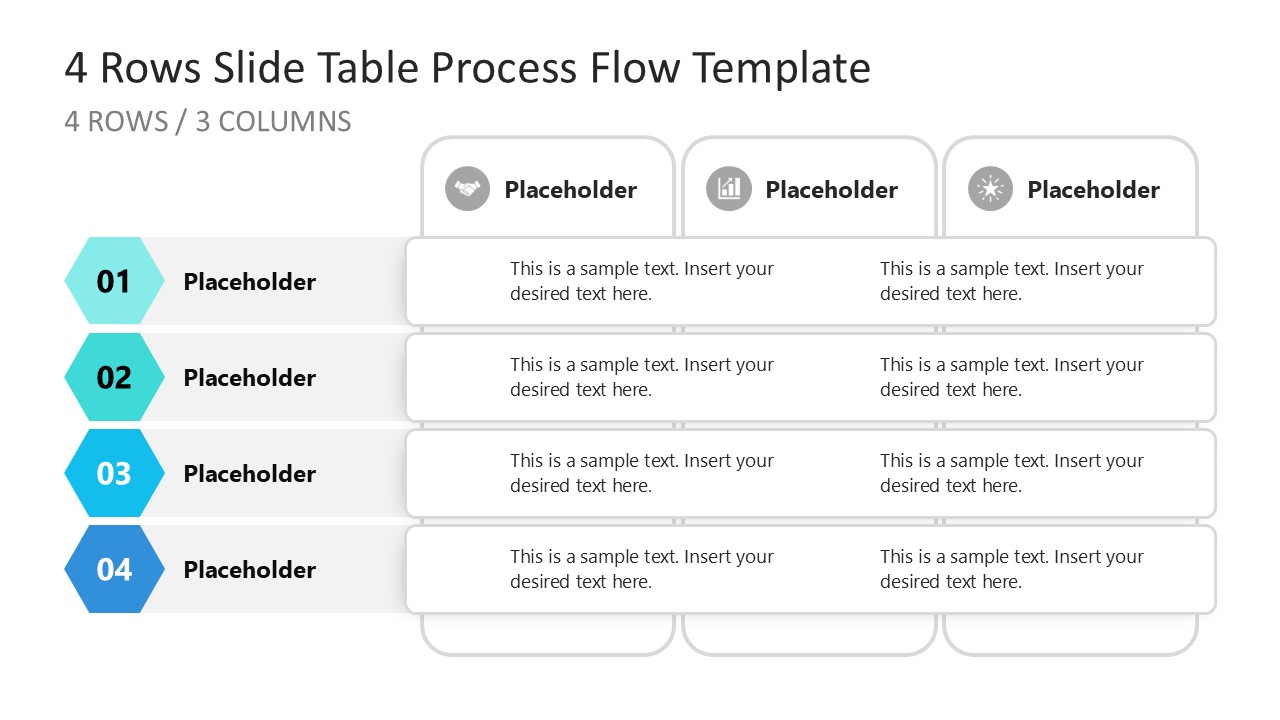
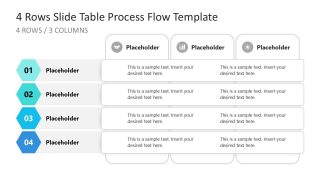
The 4 Rows PowerPoint Table Process Flow Template has two slides with a similar layout but slight differences. The first slide shows four rows and two columns, while the second has three. In the title box of each column, presenters can use infographics along with the title. At the start of each row, a small hexagon shape shows the step number, which extends into a colorful bar to join the table, and Bart shows the attribute heading. We have provided placeholder text in all the cells of the columns where professionals can mention the details about the topic.
Our process flow PPT template has editable features; users can change them based on their requirements. They can also change the template’s colors, shapes, icons, and other components to fit their needs accurately. Download this template and personalize it now! Alternatively, check our collection of table PPT templates and process flow PowerPoint templates.
What’s inside this template
Example presentation scenarios
- A project manager can use the two-column table to compare planned actions and responsible teams across four numbered milestones.
- A consultant can use the three-column table to compare three options or vendors against four decision criteria during a client workshop.
- An operations lead can use the numbered four-row process layout to explain handoffs, task owners, and stage details in a process review.
- A product manager can use the column icons and row labels to summarize feature priorities, customer impact, and delivery notes across four categories.
Features
- 100% editable presentation template
- Compatible with Microsoft PowerPoint
- 16:9 aspect ratio slides
- Scalable vector shapes, icons and illustrations
- AI-Ready for Microsoft Copilot and Claude
- Instant access and download
Frequently asked questions
Q: How should a presenter structure content in this four-row table so the audience can follow it quickly?
A: Treat each row as one decision criterion, stage, milestone, or task group. Keep the hexagon number tied to a short row label, then use the cells for concise evidence or actions. The two-column slide works best for either-or comparisons, while the three-column slide supports side-by-side review of three options.
Q: Who is this template best suited for, and what type of message does it communicate well?
A: This template fits presenters who need to organize text-heavy business content into a readable structure, such as project managers, consultants, analysts, and operations leads. It is best for explaining four process steps, comparing two or three alternatives, or listing responsibilities across four consistent categories.
Q: Why do the numbered hexagons and column icons improve the table layout?
A: The hexagons create a clear entry point for each row, so the eye reads the content in order before moving across the table. The icons in the column headers act as visual anchors for each comparison group, helping the audience separate categories without adding extra text or visual clutter.
4 Rows PowerPoint Table Process Flow Template
2-slide 16:9 presentation template for four-row process tables, comparisons, and numbered task lists
The 4 Rows PowerPoint Table Process Flow Template is a 2-slide Microsoft PowerPoint deck for structured text tables. It includes a four-row, two-column process table and a four-row, three-column comparison table with numbered hexagons, column icons, row labels, and placeholder text areas for tasks, attributes, or stages.
- Category
- Text & Tables
- Rating

 Loading...
- Aspect ratio
- 16:9
- Item ID
- 22619-01
- Colors
 Microsoft PowerPoint
  Microsoft Copilot
  Claude for PowerPoint
 Other formats supported
Subscribe today and get immediate
access to download our PowerPoint templates.