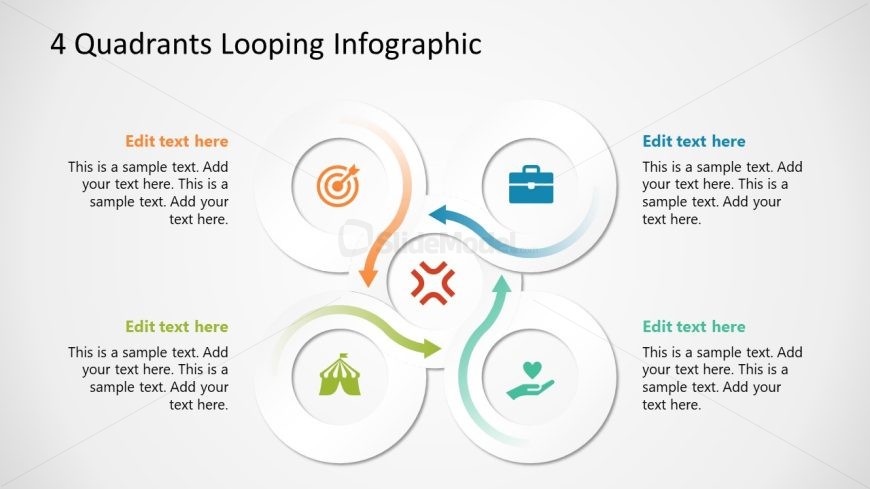
Slide 1 of 5 from 4 Quadrants Looping Infographic PowerPoint Diagram
4 Quadrants Looping Infographic PPT Diagram Template
4 Quadrants Looping Infographic Overview
- Diagram
- Matrix Quadrant
- Process Slide
- 16:9
- 100% Editable
The 4 Quadrants Looping Infographic slide from the 4 Quadrants Looping Infographic PowerPoint Diagram template offers a clear visual for process cycles in business presentations. This slide layout uses editable shapes and vector icons arranged in a quadrant matrix to illustrate interconnected steps, making it suitable for strategic planning and project management within corporate presentation slide decks.
What’s on This Slide
The layout features four circular nodes arranged in a quadrant format, each containing an icon and a text placeholder. The nodes are positioned at the corners of the slide, with a central circular shape connecting them. Arrows flow between the nodes, indicating a looping process. Each node has a unique icon representing different concepts, with text placeholders aligned below the icons. The background is light, enhancing the visibility of the nodes and arrows. The visual hierarchy emphasizes the central connection among the quadrants.
How to Use It
This layout serves as a process cycle diagram, effectively illustrating interconnected concepts or steps in a looping format. It fits well in presentations that require a visual representation of cyclical processes, such as project phases or strategic planning. This structure is useful for business scenarios like process improvement, product development cycles, or team workflows. It allows for clear communication of how different elements influence each other within a defined framework.
Text Placeholders & Capacity
Keep your copy within these limits so it fits without resizing. Node body slots can hold roughly 25-30 words each.
| Placeholder | Count | Max characters (approx.) |
|---|---|---|
| Item heading | 4 | 30 |
| Item body | 4 | 150 |
| Slide title | 1 | 40 |
Slide Keywords
Download unlimited PowerPoint templates, charts and graphics for your presentations with our annual plan.
DOWNLOADReturn to 4 Quadrants Looping Infographic PowerPoint Diagram.