Slide 1 of 2 from 4-Level Pyramid Infographic Diagram for PowerPoint
4 Level Pyramid Infographic Diagram PowerPoint
4 Level Pyramid Infographic for Presentations
- Diagram
- Pyramid
- Process Slide
- 16:9
- 100% Editable
What’s on This Slide
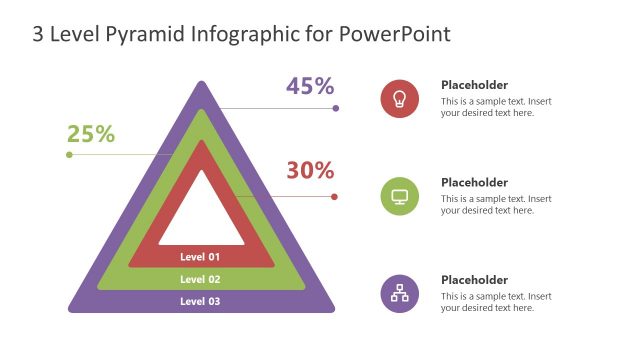
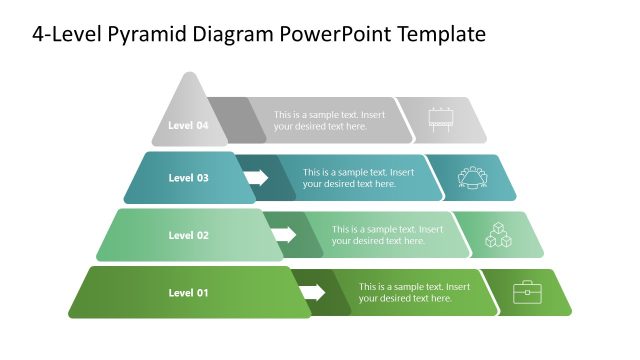
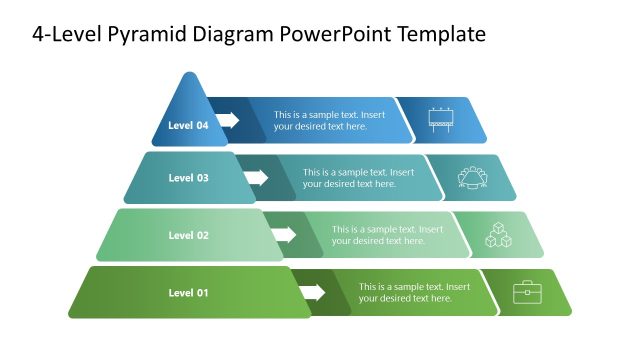
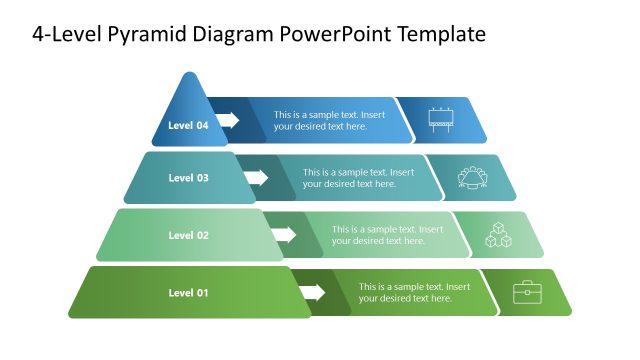
The slide features a large triangular pyramid divided into four horizontal layers, each representing different levels. The pyramid is colored in shades of blue, green, purple, and red, with each layer labeled as Level 01 to Level 04. Percentages are displayed next to the pyramid, indicating 45%, 30%, 15%, and 10% for each respective layer. To the right, there are four circular icons, each with a corresponding text placeholder below, aligned vertically. The background is light, enhancing the visibility of the pyramid and icons.
How to Use It
This layout serves as a multi-level representation, ideal for illustrating hierarchical structures or processes. It fits well in presentations that require a clear visual breakdown of components or stages, such as business strategies, project phases, or organizational structures. It is particularly useful in contexts where data needs to be visually segmented for clarity, making it suitable for reports or educational materials.
Text Placeholders & Capacity
Keep your copy within these limits so it fits without resizing. Node labels can accommodate roughly 3-4 words each.
| Placeholder | Count | Max characters (approx.) |
|---|---|---|
| Slide title | 1 | 40 |
| Item heading | 4 | 20 |
| Item body | 4 | 50 |
| Data label | 4 | 10 |
Slide Keywords
Download unlimited PowerPoint templates, charts and graphics for your presentations with our annual plan.
DOWNLOADReturn to 4-Level Pyramid Infographic Diagram for PowerPoint.